
Fig. 3
- ID
- ZDB-FIG-251007-26
- Publication
- Masud et al., 2025 - Genetic suppression features ABHD18 as a Barth syndrome therapeutic target
- Other Figures
- All Figure Page
- Back to All Figure Page
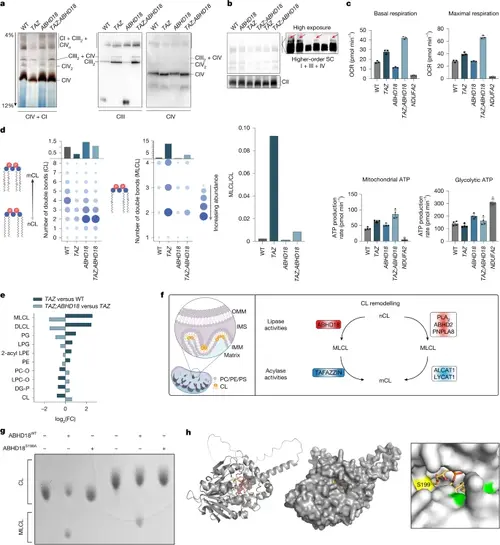
ABHD18 regulates MRC assembly and generates MLCL from nCL. a, IGA assay (CI + CIV; n = 2 biological replicates) and BN–PAGE immunoblots of isolated mitochondria from the indicated HAP1 cells. Blots were probed for CIII (UQCRC2) and CIV (COX IV + MTCO1; n = 3 biological replicates). b, BN–PAGE of the indicated HAP1 cell lines. Inset: long exposure to visualize higher-order supercomplexes (SC, mtCOX-1). c, Seahorse Cell Mito stress test in HAP1 cell lines. Box plots show respiratory parameters: basal respiration, maximal respiration, mitochondrial ATP generation and glycolytic ATP generation. Data are presented as mean ± s.d. of n = 4 technical replicates. d, Effect of TAZ-KO, ABHD18-KO and TAZ;ABHD18 double-KO on CL and MLCL abundance and composition determined by lipidomic profiling. Dot plots show CL (left) and MLCL (middle) abundance in WT and mutant HAP1 cells. The y axes show the aggregate abundance of all species with the same number of double bonds, regardless of carbon chain length, with summary bar plots shown above. Right, bar plot of MLCL/CL ratios across HAP1 cell lines e, Cellular phospholipid composition determined by lipidomics in TAZ-KO and TAZ;ABHD18 double-KO clones. The bar plot shows changes in abundance across lipid classes in TAZ-KO versus HAP1 WT and TAZ;ABHD18 double-KOs versus TAZ-KO cells (n = 3 mutant clones, nWT = 4). Only classes that are deregulated in TAZ-KO cells are shown (Padj < 0.05, determined by one-way ANOVA followed by Tukey’s honest significant difference). f, Schematic illustrating the CL biosynthesis pathway. OMM, outer mitochondrial membrane; IMS, inner mitochondrial space; IMM, inner mitochondrial membrane; PC, phosphatidylcholine; PE, phosphatidylethanolamine; PS, phosphatidylserine. g, Effect of recombinant ABHD18 on purified CL. TLC using purified ABHD18 protein and purified CL(14:1) (lower CL spot) or CL(16:0–18:1) (upper CL spot) shows that ABHD18WT but not ABHD18S199A can produce MLCL from CL. h, In silico molecular docking simulation using the GROMACS package of ABHD18 and a MLCL molecule showing the S199 residue (yellow) and other serine residues (green). Part h was reproduced from https://alphafold.ebi.ac.uk under a CC-BY 4.0 license. |