
Fig. 4
- ID
- ZDB-FIG-251007-27
- Publication
- Masud et al., 2025 - Genetic suppression features ABHD18 as a Barth syndrome therapeutic target
- Other Figures
- All Figure Page
- Back to All Figure Page
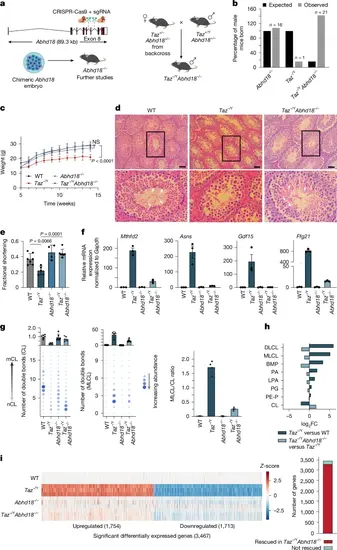
Abhd18 perturbation in Taz−/Y mice rescues BTHS phenotypes. a, Schematic showing the generation of Abhd18−/− and Taz−/Y;Abhd18−/− mice. b, Bar plot depicting the proportions of male mice for the indicated genotypes. The expected Taz−/Y and Abhd18−/− numbers follow the null hypothesis that there is no effect on the number of male mice born; Taz−/Y;Abhd18−/− follows the null hypothesis that there is no rescue of the observed Taz−/Y phenotype. Observed shows the proportion of mice genotyped. c, Body weight of mice more than ten weeks after weaning. Data are mean ± s.d. (WT, n = 8; Taz−/Y, n = 5; Abhd18−/− and Taz−/Y;Abhd18−/−, n = 13 mice). Significance was determined by one-way ANOVA followed by Dunnett’s post-hoc test (Padj = 0 WT versus Taz−/Y at week 14). d, Representative haematoxylin and eosin-stained histological images of mouse testis. White arrowheads show the nuclei of mature sperm in the lumen of seminiferous tubules (inset). The bottom row shows rotated zoomed-in images of the areas in the black boxes. Scale bars, 50 μm. e, Bar graph showing fractional shortening quantified by ultrasound analysis of murine hearts. Data are mean ± s.d. (WT, n = 7; Taz−/Y, n = 5; Abhd18−/−, n = 4; Taz−/Y;Abhd18−/−, n = 7). Significance was determined by one-way ANOVA followed by Tukey’s multiple comparisons test. f, RT–qPCR analysis of indicated gene expression levels from murine hearts, normalized to Gapdh. Data are mean ± s.e.m. (n = 3 mice). Significance determined by one-way ANOVA and Tukey’s multiple comparison test. g, Dot plots of lipidomic analyses of CL (left) and MLCL (middle) species abundance in murine hearts, with summary bar plots shown above. Right, bar plot quantifying MLCL/CL ratios (right). Data are means; n = 6 mice per genotype, except Taz−/Y (n = 4). h, Bar plot of lipid abundance changes in Taz−/Y versus WT, and Taz−/Y;Abhd18−/− versus Taz−/Y murine hearts (n as in panel g). i, Bulk RNA-seq analysis of murine hearts (n = 3 mice per genotype). Significant differentially expressed genes in each genotype (FDR < 0.01, |LFC | > 0.58) are shown, z-normalized to WT samples (left). Right, bar plot showing the number of Taz-KO genes rescued in Taz−/Y;Abhd18−/− mouse heart (right). |