FIGURE SUMMARY
Title

Unveiling the role of Ndrg1 gene on the oxidative stress induction behind the anticancer potential of styrylquinazoline derivatives

Authors
Malarz, K., Kuczak, M., Rurka, P., Rawicka, P., Boguszewska-Czubara, A., Jampilek, J., Mularski, J., Musiol, R., Mrozek-Wilczkiewicz, A.
Source
Full text @ Sci. Rep.

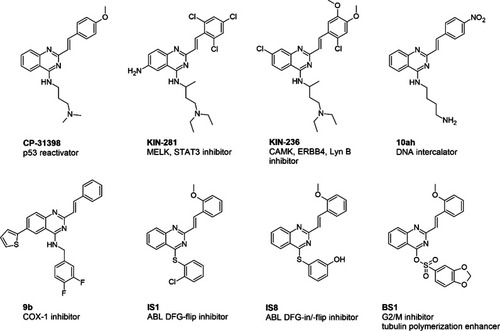
Diversity of 2-styrylquinazoline-core compounds and their biological signature in cancer cells.

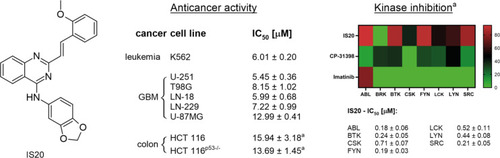
The chemical structure of IS20 (6b) styrylquinazoline, along with its anticancer activity on a panel of cancer cell lines with different TP53 gene status and kinase inhibition profiles. aValues for anticancer activity of IS20 against HCT 116 cells, as well as kinase inhibition activity by IS20, CP-31398, and imatinib, were taken from our previous work13.

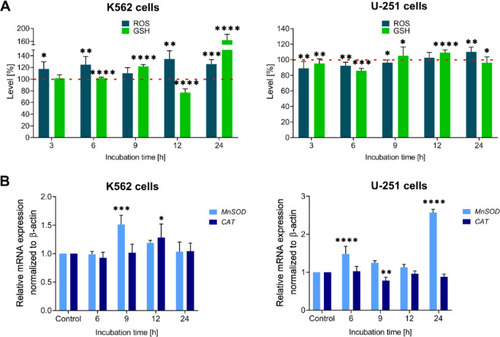
The time-dependent impact of the tested IS20 derivative on ROS (navy blue bars) and GSH (green bars) levels in the K562 and U-251 cells (A). The mRNA expression of MnSOD, and CAT genes in the K562 and U-251 cells after incubation with IS20 in kinetic experiments (B). The data were normalized to the control–untreated cells and analyzed using the unpaired t-test: *p < 0.05, **p < 0.01, ***p < 0.001, ****p < 0.0001 compared to the control. The results are presented as the mean ± SD of several independent experiments (n = 5). The red dashed lines indicate the standardized levels of ROS and GSH in the control, which is taken to be 100%.

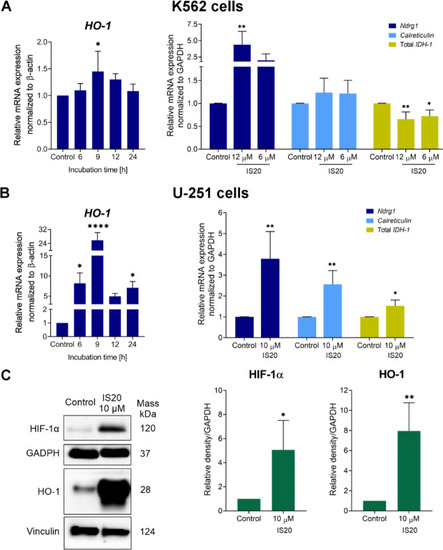
The impact of IS20 on the expression of selected genes and proteins associated with oxidative stress and iron regulation in the K562 (A) and U-251 cells (B,C). The HO-1 expression was determined in kinetic experiments, while Ndrg1, calreticulin, and IDH-1 gene expression after 24-hour incubation. The levels of HO-1 and HIF-1α proteins were determined after 24-h treatment with IS20 in U-251 cells. The results of gene and protein expression are presented as the mean ± SD of several independent experiments (n = 5). Immunoblots shown are representative of five independent experiments. The displayed blots were cropped, and the full-length blots are shown in Fig. S6. The statistical analysis was performed using a t-test or one-way ANOVA with Bonferroni’s posthoc test: *p < 0.05, **p < 0.01, ***p < 0.001, ****p < 0.0001 compared to the untreated controls.

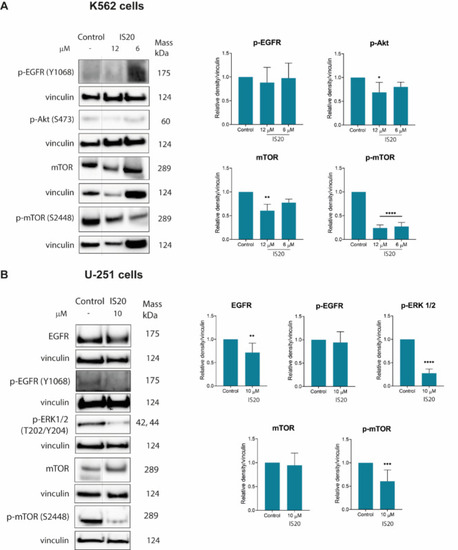
The impact of IS20 on the expression of EGFR and its downstream signaling proteins in K562 (A) and U-251 (B) cells. The results of protein expression are presented as the mean ± SD of six independent experiments (n = 6). Immunoblots shown are representatives from these independent experiments. The displayed blots were cropped, and the full-length blots are shown in Fig. S6. Statistical significance is presented above as *p < 0.05, **p < 0.01, ***p < 0.001, ****p < 0.0001 relative to the respective control, statistical analysis was done using one-way ANOVA with Bonferroni’s posthoc test (for Western Blot) or Dunn–Šidák correction test (for Lumit Immunoassay).

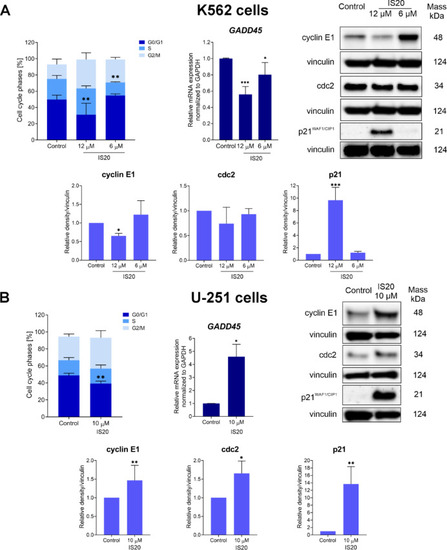
The impact of IS20 on the progression of the cell cycle and related molecules in the K562 (A) and U-251 (B) cells. The chart presents the percentage of cells in the G0/G1, S and the G2/M phases of the cell cycle. The mRNA expression of GADD45 in the cells and immunoblotting results with densitometric analysis of cyclin E1, cdc2 and p21 CIP1/WAF1 protein expression after 24-hour treatment with IS20. Results were normalized to the reference gene/protein and are from five independent experiments (n = 5). Immunoblots shown are representative from these independent experiments. The displayed blots were cropped, and the full-length blots are shown in Fig. S6. All presented data were analyzed using a one-way ANOVA with Bonferroni’s post-hoc test: *p < 0.05, **p < 0.01, ***p < 0.001, ****p < 0.0001 compared to the control.

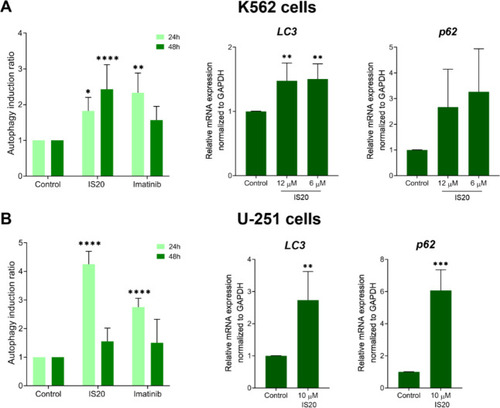
The influence of IS20 on the autophagy induction and expression of autophagy-related genes in the K562 (A) and U-251 (B) cells. The expression of LC3 and p62 genes was determined in both cell lines after a 24 h incubation with IS20. The results are presented as the mean ± SD from five independent experiments (n = 5). The statistical analyses were carried out using a one-way ANOVA with Bonferroni’s post-hoc test: *p < 0.05, **p < 0.01, ***p < 0.001, ****p < 0.0001 compared to the untreated cells (control).

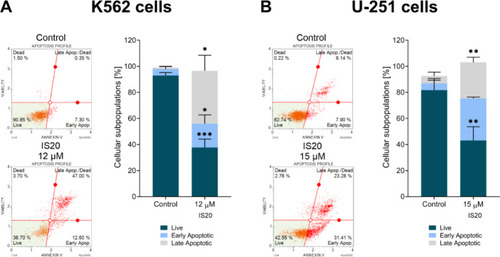
The impact of IS20 on the induction of apoptosis in the K562 (A) and U-251 (B) cells. The histograms display the percentage of live, early, and late independent experiments. The statistical analysis of the data was performed using a one-way ANOVA with Bonferroni’s post-hoc test: *p < 0.05, **p < 0.01, ***p < 0.001, ****p < 0.0001 compared to the untreated cells (control).

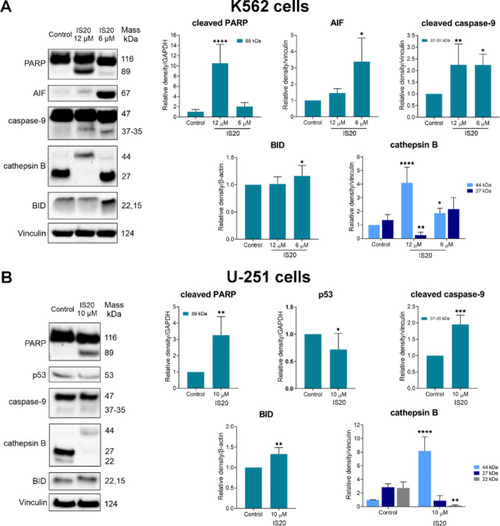
The impact of IS20 on the induction of expression of apoptosis-related proteins in the K562 (A) and U-251 (B) cells. Results were normalized to the reference protein and are from five independent experiments (n = 5). Immunoblots shown are representative from these independent experiments. The displayed blots were cropped, and the full-length blots are shown in Fig. S6. The statistical analysis of the data was performed using a one-way ANOVA with Bonferroni’s post-hoc test: *p < 0.05, **p < 0.01, ***p < 0.001, ****p < 0.0001 compared to the untreated cells (control).

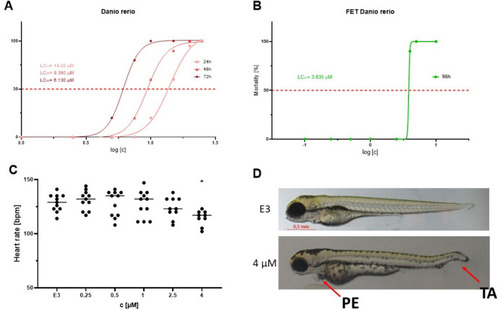
The toxicity of IS20 in Danio rerio experimental model. (A) Toxicity (expressed as LC50) after 24, 48 and 72 h of incubation with IS20; (B) Toxicity (expressed as LC50) of IS20 in FET after 96 h of incubation; (C) Cardiotoxicity, measured as heart rate [beats per minute], the statistical analysis of the data was performed using a one-way ANOVA with Tukey’s post-hoc test: *p < 0.05 compared to the untreated control (E3) fish; (D) Example of malformations stated for the incubation with IS20 versus untreated control (E3) fish; PE pericardial edema, TA tail autophagy.

Acknowledgments
This image is the copyrighted work of the attributed author or publisher, and ZFIN has permission only to display this image to its users. Additional permissions should be obtained from the applicable author or publisher of the image. Full text @ Sci. Rep.