|
Fig. 3
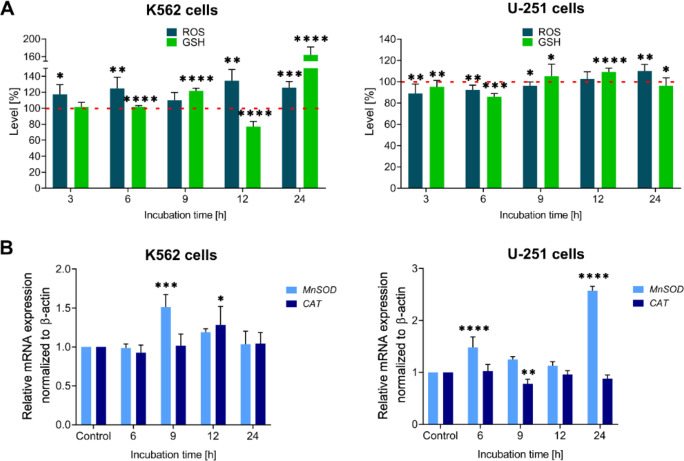
The time-dependent impact of the tested IS20 derivative on ROS (navy blue bars) and GSH (green bars) levels in the K562 and U-251 cells (

|
|
Fig. 3
The time-dependent impact of the tested IS20 derivative on ROS (navy blue bars) and GSH (green bars) levels in the K562 and U-251 cells (