FIGURE SUMMARY
Title

Designed optogenetic tool for bridging single-neuronal multimodal information in intact animals

Authors
Tao, R.K., Sun, L., Qian, Y., Huang, Y.M., Chen, Y.H., Guan, C.Y., Wang, M.C., Sun, Y.D., Du, J.L.
Source
Full text @ Nat. Commun.

Nuclear PhoCl allows single-cell manipulation in vivo.

a Schematic illustration showing the fluorescence detection of neuronal nuclear PhoCl in zebrafish at 6 days-post-fermentation (dpf). Two groups of larvae were raised under different conditions: one in constant darkness (Dark) and the other in an ambient light environment (ALE, ~250 lx). The fish raised in the dark were treated with 2 min 405-nm LED stimulation (0.2 mW/mm2). Activation of nuclear PhoCl converts its green fluorescence to red, which then becomes colorless following self-cleavage. Representative maximum projection images along the z-axis (b) and grouped analysis (c) of nuclear PhoCl and Kaede fluorescence signals in the brain (n = 7, 7, 10, 7, 12, 7 fish for each group accordingly). Scale bars: 50 μm. Some error bars in the grouped analysis are too small to be visible. The outline of the fish brain without eyes is highlighted with a dashed line. Data are shown as mean ± s.e.m. Statistical significance was determined using a two-tailed Mann–Whitney U test (Dark and LED) or a Chi-squared test (ALE). d Representative z-axis maximum projection images showing H2B-PhoCl signals in the brain (n = 7 fish). The dashed square indicates the region for activation, with pre-activation (Pre) and post-activation (Post) images shown in the upper left and upper right corners, respectively. Scale bars: 50 μm in whole images, 10 μm in zoomed views. e Single-slice fluorescence image demonstrating the sequential activation of three neurons expressing nuclear PhoCl under 405-nm laser (0.5 μW) for 10 s. Neuron 1 is marked with a white arrowhead, neuron 2 with a blue arrowhead, and neuron 3 with an orange arrowhead. Scale bars: 10 μm (n = 7 fish). See also Supplementary Fig. 1.

In vitro and in vivo characterization of a PhoCl-based single-cell labeling system.

a Schematic depicting Pisces0.1 characterization in H1299 cell cultures. Pisces0.1 shows both green and red fluorescence in the nucleus. The green fluorescence vanishes after 2 min of continuous 405-nm laser activation (7.5 μW), followed by PhoCl translocation to the cytosol after self-cleavage. b Fluorescence images of H1299 cells expressing Pisces0.1 before and after 405-nm laser illumination. Scale bars: 10 μm (n = 4 imaging experiments). Fluorescence traces of six cells (indicated by white arrowheads) can be found in Supplementary Fig. 2df. c Schematic of Pisces0.1 and Pisces characterization in 6-dpf larval zebrafish using bulk activation with a custom LED setup (1.4 mW/mm², 2 min). Representative images of zebrafish larvae expressing neuronal Pisces0.1 (d) and Pisces (e). Zoomed-in regions (dashed rectangle) of individual neurons are highlighted. Neuronal Pisces0.1 shows cytosolic leakage (blue arrowheads) before activation and insufficient translocation after activation (white arrowheads). In contrast, all Pisces-positive neurons display proper nuclear localization and complete translocation after activation. Larvae were raised in constant darkness. Scale bars: 50 μm in whole images, 10 μm in zoomed views (n = 6 fish). See also Supplementary Fig. 2, Supplementary Note 1 and Supplementary Movie 1.

In vivo characterization of Pisces for tracing single-neuron morphology.

a Schematic representation of Pisces expression in the habenula, locus coeruleus (LC), and the whole brain of 3 or 6-dpf larval zebrafish. Single pulses of a 405-nm laser (0.5 μW for 60 s or 1.5 μW for 10 s) were used for activation. b Time-lapse imaging demonstrates the rapid axonal trafficking of Pisces in tectal neurons following 405-nm laser activation (1.5 μW for 10 s) on 6-dpf larval zebrafish. White arrowheads show the axonal progression of Pisces labeling, while blue arrowheads mark the activated neuron nucleus. Pisces labels the entire axon within 2 min, and all processes are labeled within 30 min. The estimated axon trafficking rate is 1.02 ± 0.06 μm/s based on 14 neurons. The morphological trace of an activated neuron is shown on the right. Scale bars: 10 μm. Larvae were raised in constant darkness. Representative z-axis maximum projection images of the morphological projections of two activated habenula neurons on both sides (c) and one LC-NE neuron (d) on 6-dpf larval zebrafish. The brightness of red fluorescence was adjusted to visualize the nuclei of activated neurons in the lower panels. Numbers and white arrowheads indicate the activated neurons. Morphological traces of each neuron are displayed on the right (n = 3 fish). Scale bars: 50 μm in whole images, 10 μm in zoomed views. Hb habenula, IPN interpeduncular nucleus. Larvae were raised in constant darkness. e Fluorescent images showing tectal neuron morphology (left, at 2 h post-activation), and neurites and filopodia (right) dynamics of a tectal neuron in a 3-dpf zebrafish over 14 h. White arrowheads indicate neurite changes. Laser activation was performed with 405-nm (0.5 μW for 60 s) (n = 6 fish). Scale bars: 10 μm. Raw images and traces can be found in Supplementary Fig. 4c. Larvae were raised in ALE. See also Supplementary Figs. 35 and Supplementary Movies 26.

Pisces enables tracing the morphology of adjacent neurons and separated neurons across the brain.

a Schematic illustrating the sequential activation of two neighboring neurons in the midbrain of 6-dpf larval zebrafish. b, c Fluorescent images showing the morphology of two tectal neurons activated sequentially. The first neuron (“1”) was designated by a white arrowhead, and the second (“2”) by a blue arrowhead (b). The dashed box highlights two sequentially activated neurons, shown in detail in the zoomed-in view below. Morphological traces of these two adjacent neurons are displayed in (c). Larvae were raised under ALE conditions. Scale bars: 50 μm in whole images, 10 μm in zoomed views. n = 6 fish. Representative z-axis maximum projection images (d), corresponding zoomed-in views, and morphological tracing (e) of nine neurons activated across the entire brain on 6-dpf larval zebrafish. Numbers indicate the activated neurons, which are shown in higher magnification in the zoomed-in panels on the right (n = 3 fish). Note that neuron 9 is not included in the pre-activation image. Larvae were raised in constant darkness. Scale bars: 50 μm in whole images, 10 μm in zoomed views. See also Supplementary Fig. 5, Supplementary Movies 79.

Integrative characterization of morphology and function of individual tectal neurons in vivo.

a Schematic of the experimental design combining light-induced calcium imaging and morphological reconstruction of tectal neurons. Signals in the peri-nuclear soma region were used for functional measurements (scale bars: 2 μm). Morphological tracing via nuclear Pisces activation (scale bars: 10 μm). Reconstructions registered to the brain template. Neuropil is shaded in gray. b Five distinct neuron types were categorized by aligning average calcium response traces with light stimulation patterns. Representative traces (top), neuronal morphologies (middle), and registered reconstructions (bottom) are shown (scale bar: 10 μm). Types include tON (n = 7), sON (n = 27), tOFF (n = 21), sOFF (n = 17), and ON-OFF (n = 29). c Collection of all periventricular interneurons (PVIN, n = 56) and periventricular projection neurons (PVPN, n = 58), registered to the brain template. d Pie charts showing neuron-type proportions within the PVIN (top) and PVPN (bottom) populations. Statistical significance was determined using a Chi-squared test. Detailed n numbers are in Source Data. e Proportions (prop.) of process length for PVIN (top) and PVPN (bottom) neurons across different neuropil layers. SM stratum marginale, SO stratum opticum, SFGS stratum fibrosum et griseum superficiale, SGC stratum griseum centrale, SAC stratum album centrale, SPV stratum periventriculare. f Collection of all contralateral (n = 13) and ipsilateral (n = 21) descending projecting PVPN neurons, registered to the brain template. Note that a minority of ipsilateral neurons (n = 2) project across the midline. Proportional statistics (g) and coefficient of variation analysis (h) comparing luminance response, dendrite length, and axon length distribution between contralateral (con.) and ipsilateral (ips.) projecting PVPN neurons (n = 20). OTAOS optic tract and accessory optic system, Hyp hypothalamus, Teg tegmentum, TS torus semicircularis, IN interpeduncular nucleus, Rh rhombomere (numbers denote different segments). Error bars represent s.e.m. Statistical significance was determined using a Chi-squared test. See also Supplementary Fig. 6, Supplementary Movies 10 and 11.

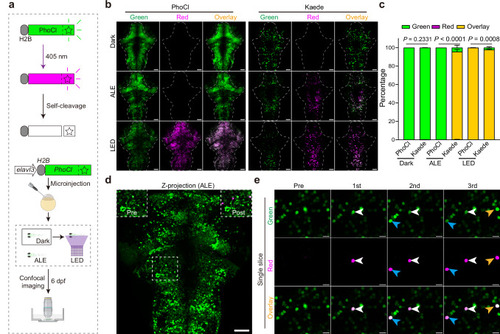
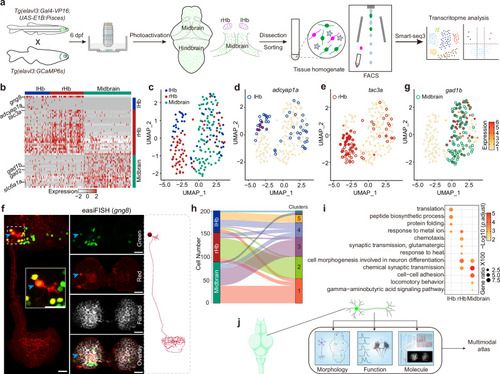
Transcriptome analysis of Pisces-activated GCaMP6s-positive neurons.

a Overview of the workflow for isolating and analyzing single-cell transcriptomes from Pisces-activated, GCaMP6s-positive neurons in the left habenula (lHb), right habenula (rHb), and midbrain. b Heatmap showing differentially expressed genes across lHb, rHb, and midbrain neurons. Marker genes include gng8 (habenula-specific), adcyap1a (lHb), tac3a (rHb), gad1b, gad2, and slc6a1a (midbrain). c Uniform manifold approximation and projection (UMAP) clustering of neurons from lHb (n = 48), rHb (n = 64), and midbrain (n = 90) identify three distinct populations. Distribution patterns of habenular neurons expressing enriched marker genes in the UMAP clusters, including adcyap1a in the lHb (d) and tac3a in the rHb (e). f Representative z-axis maximum projection images of all 211 slices illustrating the integration of gng8 mRNA spatial localization and single habenular neuron morphology in zebrafish larvae expressing neuronal Pisces. Left: Morphology of individual habenular neurons, imaging before easiFISH with a zoomed-in view of the activated neuron (dashed square). Middle: Projection images of 10 slices showing gng8 mRNA expression detected by easiFISH. Nuclear-localized Pisces, activated neurons, and mRNA signals are shown in green, red, and far-red (white), respectively. After easiFISH, neurite signals diminish, leaving only nuclear fluorescence. Right: Morphological reconstructions of neurons before easiFISH. Activated neuron indicated by blue arrows. Similar results were observed from 3 larvae (ALE conditions). Scale bars: 20 μm. g Distribution patterns of midbrain neurons expressing enriched marker genes gad1b in the UMAP clusters. h Sankey plot illustrating the relationships between known lHb, rHb, and midbrain neurons and eight unsupervised cell clusters identified in the unbiased UMAP analysis. Clusters 1–5 are labeled; clusters 6–8 are included but unlabeled due to space limitations. Mutual information (MI = 0.50) indicates the distinct characteristics of each cell type. i Gene Ontology (GO) enrichment analysis for neurons from the three brain regions. Statistics were performed using a two-sided Hypergeometric test with Benjamini–Hochberg correction for multiple comparisons. Summary model integrating molecular, morphological, and functional data from single neurons across the whole brain in vivo using the Pisces system. See also Supplementary Fig. 7, Supplementary Movies 12 and 13.

Acknowledgments
This image is the copyrighted work of the attributed author or publisher, and ZFIN has permission only to display this image to its users. Additional permissions should be obtained from the applicable author or publisher of the image. Full text @ Nat. Commun.