|
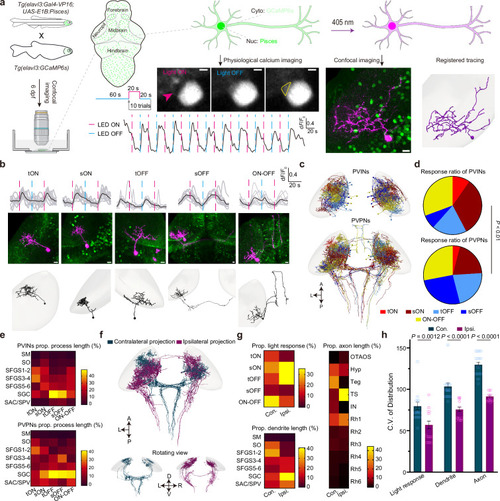
Integrative characterization of morphology and function of individual tectal neurons in vivo. a Schematic of the experimental design combining light-induced calcium imaging and morphological reconstruction of tectal neurons. Signals in the peri-nuclear soma region were used for functional measurements (scale bars: 2 μm). Morphological tracing via nuclear Pisces activation (scale bars: 10 μm). Reconstructions registered to the brain template. Neuropil is shaded in gray. b Five distinct neuron types were categorized by aligning average calcium response traces with light stimulation patterns. Representative traces (top), neuronal morphologies (middle), and registered reconstructions (bottom) are shown (scale bar: 10 μm). Types include tON (n = 7), sON (n = 27), tOFF (n = 21), sOFF (n = 17), and ON-OFF (n = 29). c Collection of all periventricular interneurons (PVIN, n = 56) and periventricular projection neurons (PVPN, n = 58), registered to the brain template. d Pie charts showing neuron-type proportions within the PVIN (top) and PVPN (bottom) populations. Statistical significance was determined using a Chi-squared test. Detailed n numbers are in Source Data. e Proportions (prop.) of process length for PVIN (top) and PVPN (bottom) neurons across different neuropil layers. SM stratum marginale, SO stratum opticum, SFGS stratum fibrosum et griseum superficiale, SGC stratum griseum centrale, SAC stratum album centrale, SPV stratum periventriculare. f Collection of all contralateral (n = 13) and ipsilateral (n = 21) descending projecting PVPN neurons, registered to the brain template. Note that a minority of ipsilateral neurons (n = 2) project across the midline. Proportional statistics (g) and coefficient of variation analysis (h) comparing luminance response, dendrite length, and axon length distribution between contralateral (con.) and ipsilateral (ips.) projecting PVPN neurons (n = 20). OTAOS optic tract and accessory optic system, Hyp hypothalamus, Teg tegmentum, TS torus semicircularis, IN interpeduncular nucleus, Rh rhombomere (numbers denote different segments). Error bars represent s.e.m. Statistical significance was determined using a Chi-squared test. See also Supplementary Fig. 6, Supplementary Movies 10 and 11.
|