|
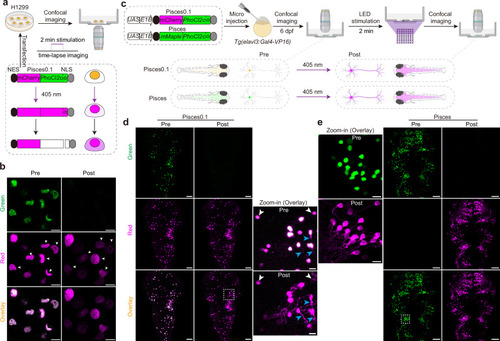
In vitro and in vivo characterization of a PhoCl-based single-cell labeling system. a Schematic depicting Pisces0.1 characterization in H1299 cell cultures. Pisces0.1 shows both green and red fluorescence in the nucleus. The green fluorescence vanishes after 2 min of continuous 405-nm laser activation (7.5 μW), followed by PhoCl translocation to the cytosol after self-cleavage. b Fluorescence images of H1299 cells expressing Pisces0.1 before and after 405-nm laser illumination. Scale bars: 10 μm (n = 4 imaging experiments). Fluorescence traces of six cells (indicated by white arrowheads) can be found in Supplementary Fig. 2d–f. c Schematic of Pisces0.1 and Pisces characterization in 6-dpf larval zebrafish using bulk activation with a custom LED setup (1.4 mW/mm², 2 min). Representative images of zebrafish larvae expressing neuronal Pisces0.1 (d) and Pisces (e). Zoomed-in regions (dashed rectangle) of individual neurons are highlighted. Neuronal Pisces0.1 shows cytosolic leakage (blue arrowheads) before activation and insufficient translocation after activation (white arrowheads). In contrast, all Pisces-positive neurons display proper nuclear localization and complete translocation after activation. Larvae were raised in constant darkness. Scale bars: 50 μm in whole images, 10 μm in zoomed views (n = 6 fish). See also Supplementary Fig. 2, Supplementary Note 1 and Supplementary Movie 1.
|