IMAGE

Fig. 4

ID
ZDB-IMAGE-250826-8
Source
Figures for Tao et al., 2025
Image
Figure Caption

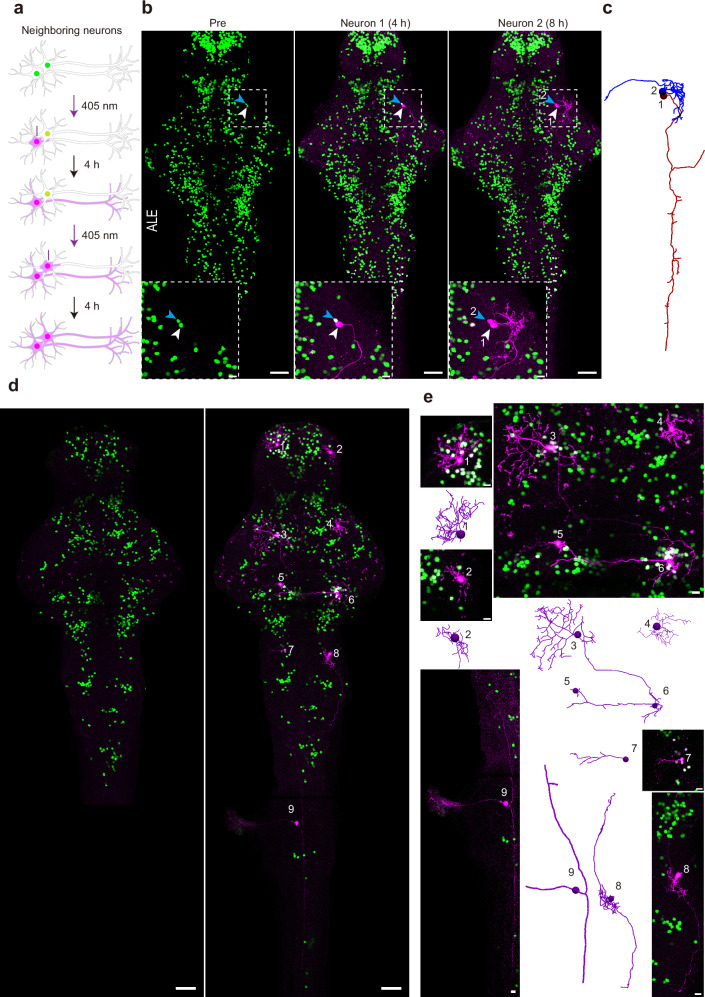
Fig. 4 Pisces enables tracing the morphology of adjacent neurons and separated neurons across the brain.

a Schematic illustrating the sequential activation of two neighboring neurons in the midbrain of 6-dpf larval zebrafish. b, c Fluorescent images showing the morphology of two tectal neurons activated sequentially. The first neuron (“1”) was designated by a white arrowhead, and the second (“2”) by a blue arrowhead (b). The dashed box highlights two sequentially activated neurons, shown in detail in the zoomed-in view below. Morphological traces of these two adjacent neurons are displayed in (c). Larvae were raised under ALE conditions. Scale bars: 50 μm in whole images, 10 μm in zoomed views. n = 6 fish. Representative z-axis maximum projection images (d), corresponding zoomed-in views, and morphological tracing (e) of nine neurons activated across the entire brain on 6-dpf larval zebrafish. Numbers indicate the activated neurons, which are shown in higher magnification in the zoomed-in panels on the right (n = 3 fish). Note that neuron 9 is not included in the pre-activation image. Larvae were raised in constant darkness. Scale bars: 50 μm in whole images, 10 μm in zoomed views. See also Supplementary Fig. 5, Supplementary Movies 79.

Acknowledgments
This image is the copyrighted work of the attributed author or publisher, and ZFIN has permission only to display this image to its users. Additional permissions should be obtained from the applicable author or publisher of the image. Full text @ Nat. Commun.