|
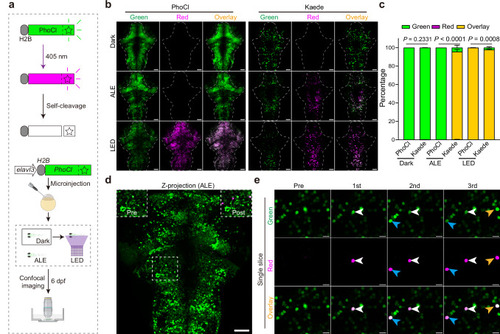
Nuclear PhoCl allows single-cell manipulation in vivo. a Schematic illustration showing the fluorescence detection of neuronal nuclear PhoCl in zebrafish at 6 days-post-fermentation (dpf). Two groups of larvae were raised under different conditions: one in constant darkness (Dark) and the other in an ambient light environment (ALE, ~250 lx). The fish raised in the dark were treated with 2 min 405-nm LED stimulation (0.2 mW/mm2). Activation of nuclear PhoCl converts its green fluorescence to red, which then becomes colorless following self-cleavage. Representative maximum projection images along the z-axis (b) and grouped analysis (c) of nuclear PhoCl and Kaede fluorescence signals in the brain (n = 7, 7, 10, 7, 12, 7 fish for each group accordingly). Scale bars: 50 μm. Some error bars in the grouped analysis are too small to be visible. The outline of the fish brain without eyes is highlighted with a dashed line. Data are shown as mean ± s.e.m. Statistical significance was determined using a two-tailed Mann–Whitney U test (Dark and LED) or a Chi-squared test (ALE). d Representative z-axis maximum projection images showing H2B-PhoCl signals in the brain (n = 7 fish). The dashed square indicates the region for activation, with pre-activation (Pre) and post-activation (Post) images shown in the upper left and upper right corners, respectively. Scale bars: 50 μm in whole images, 10 μm in zoomed views. e Single-slice fluorescence image demonstrating the sequential activation of three neurons expressing nuclear PhoCl under 405-nm laser (0.5 μW) for 10 s. Neuron 1 is marked with a white arrowhead, neuron 2 with a blue arrowhead, and neuron 3 with an orange arrowhead. Scale bars: 10 μm (n = 7 fish). See also Supplementary Fig. 1.
|