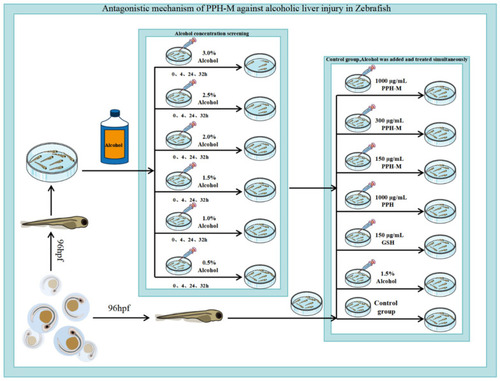
Establishment of alcoholic liver injury model in zebrafish and animal experimental design of antagonistic effect of PPH-M on alcohol-induced liver injury in zebrafish.

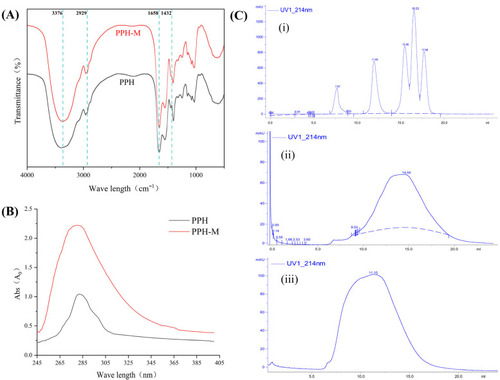
Structural characterization of PPH and PPH-M. (
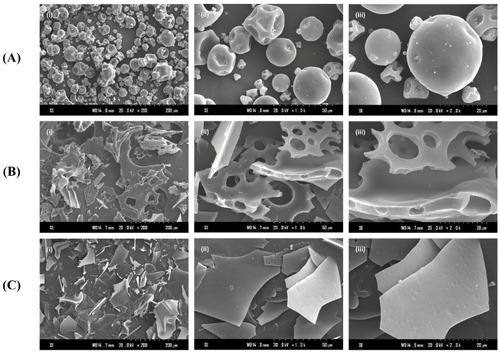
A) The FTIR of PPH and PPH-M. (B) UV spectrogram of PPH and PPH-M. (C) Molecular weight distribution elution of PPH and PPH-M, (i) standard protein, (ii) PPH, and (iii) PPH-M.

SEM of (A) pea protein, (B) PPH, and (C) PPH-M. (i) ×200, (ii) ×1000, and (iii) ×2000.

(A) Particle size of PPH and PPH-M. (B,C) Amino acid composition analysis of PPH and PPH-M.

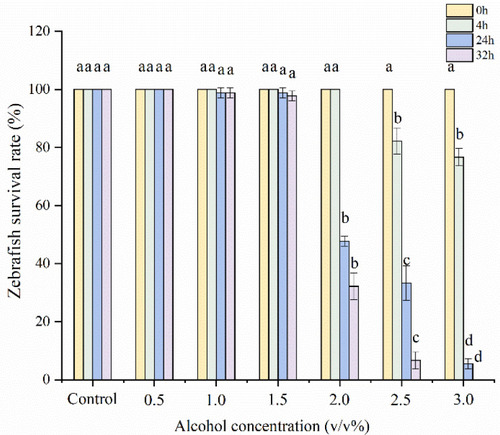
Effect of alcohol concentration on survival of zebrafish. Different lowercase letters represent significant differences within groups (p < 0.05).

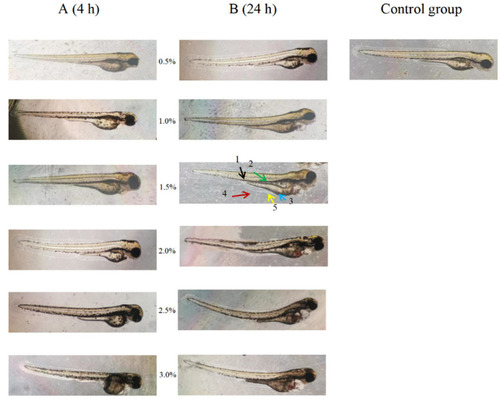
Effects of alcohol concentration and time on zebrafish morphology: (A) 4 h and (B) 24 h. Black arrow represents spine, green arrow represents swim bladder, blue arrow represents pericardium, red arrow represents yolk sac, and yellow arrow represents luminal hemorrhage.

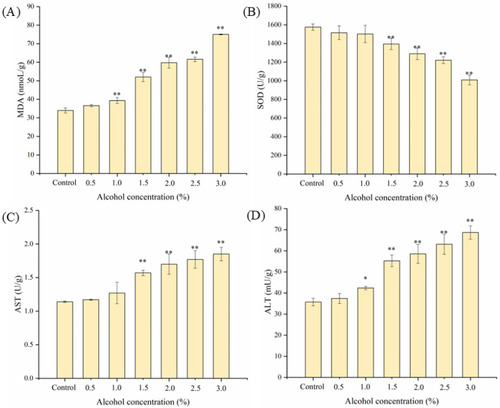
Effects of alcohol concentration on (A) MDA, (B) SOD, (C) AST, and (D) ALT in zebrafish. Compared with control group, * represents significant differences (p < 0.05) and ** represents extremely significant differences (p < 0.01).

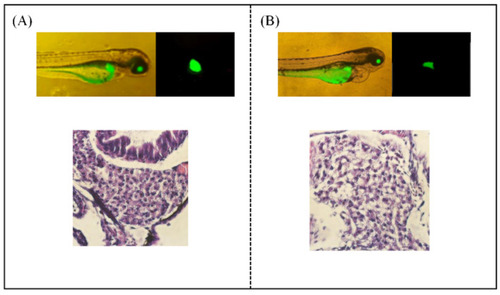
Effect of alcohol on liver injury in zebrafish. Fluorescence intensity of zebrafish liver was observed by fluorescence microscope, and pathology of zebrafish liver tissue: (A) the control group and (B) the model group.

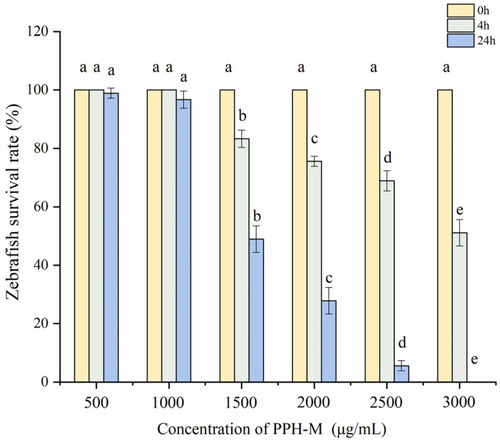
Effect of PPH-M concentration on zebrafish survival. Different lowercase letters represent significant differences within groups (p < 0.05).

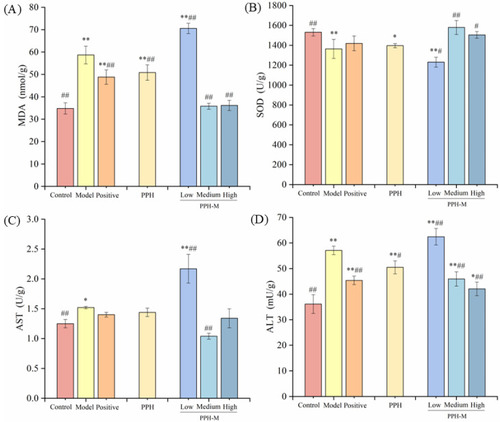
Effects of PPH-M on (A) MDA, (B) SOD, (C) AST, and (D) ALT in zebrafish. The concentration of the low-dose group was 150 μg/mL, the medium-dose group was 300 μg/mL, and the high-dose group was 1000 μg/mL. The concentration of the PPH was 1000 μg/mL, and the GSH was 150 μg/mL. Compared with the control group, * represents significant differences (p < 0.05) and ** represents extremely significant differences (p < 0.01). Compared with the model group, # represents significant differences (p < 0.05) and ## represents extremely significant differences (p < 0.01).

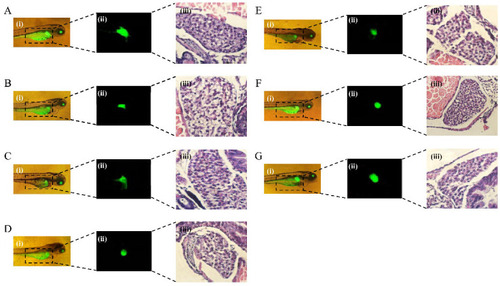
Protective effect of PPH-M intervention on alcohol-induced zebrafish injury, fluorescence images, and pathological sections of liver. (A) The control group, (B) the model group, (C) the positive group (GSH), 150 μg/mL, (D) the PPH group, 1000 μg/mL, (E) the PPH-M low-dose group, 150 μg/mL, (F) the PPH-M medium-dose group, 300 μg/mL, and (G) the PPH-M high-dose group, 1000 μg/mL. (i) The zebrafish captured by a fluorescence microscope, (ii) Fluorescence intensity of zebrafish liver was observed by fluorescence microscope, and (iii) pathology of zebrafish liver tissue.

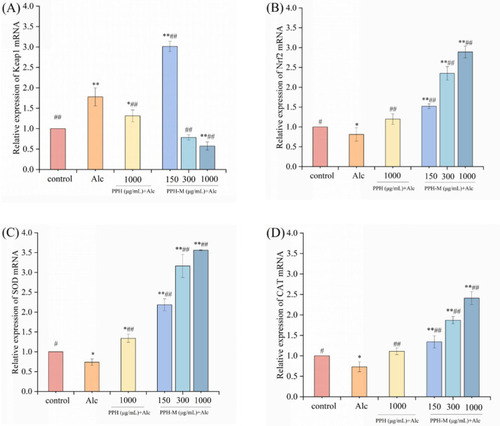
Effect of PPH-M intervention on relative gene expression of the Keap1/Nrf2 signaling pathway in zebrafish. (A) Keap1, (B) Nrf2, (C) SOD, and (D) CAT. Compared with the control group, * represents significant differences (p < 0.05) and ** represents extremely significant differences (p < 0.01). Compared with the model group, # represents significant differences (p < 0.05) and ## represents extremely significant differences (p < 0.01).

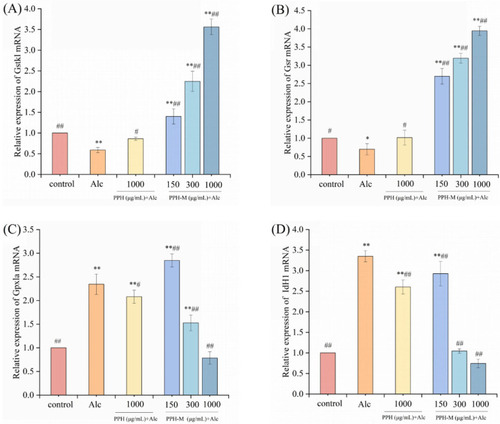
Effect of PPH-M on relative gene expression of the glutathione synthesis in zebrafish. (A) Gstk1, (B) Gsr, (C) Gpxla, and (D) IdH1. Compared with the control group, * represents significant differences (p < 0.05) and ** represents extremely significant differences (p < 0.01). Compared with the model group, # represents significant differences (p < 0.05) and ## represents extremely significant differences (p < 0.01).

Acknowledgments
This image is the copyrighted work of the attributed author or publisher, and ZFIN has permission only to display this image to its users. Additional permissions should be obtained from the applicable author or publisher of the image. Full text @ Nutrients