
Image
|
Figure Caption
Figure 12
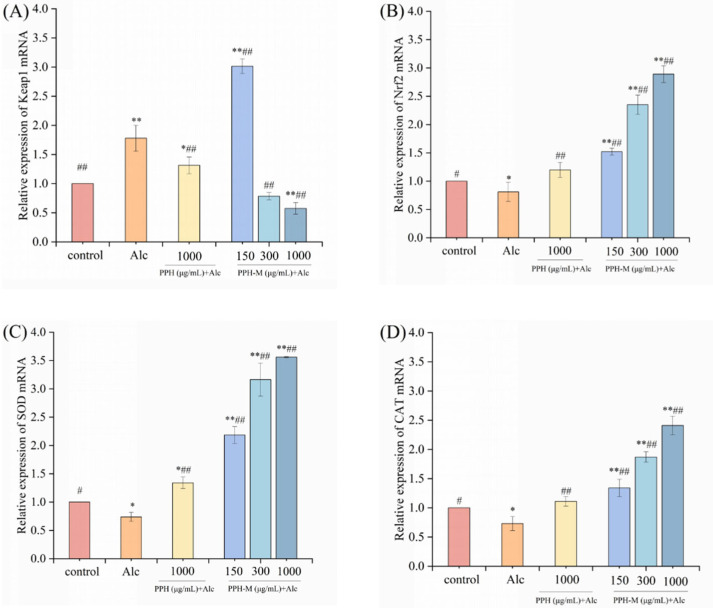
Effect of PPH-M intervention on relative gene expression of the Keap1/Nrf2 signaling pathway in zebrafish. (
Acknowledgments
This image is the copyrighted work of the attributed author or publisher, and
ZFIN has permission only to display this image to its users.
Additional permissions should be obtained from the applicable author or publisher of the image.
Full text @ Nutrients