FIGURE SUMMARY
Title

Somites are a source of nephron progenitors in zebrafish

Authors
Peng, Z., Vanichapol, T., Nguyen, P.D., Chang, H.G., Kocha, K.M., O'Brien, L.L., Currie, P.D., Huang, P., Davidson, A.J.
Source
Full text @ Nat. Commun.

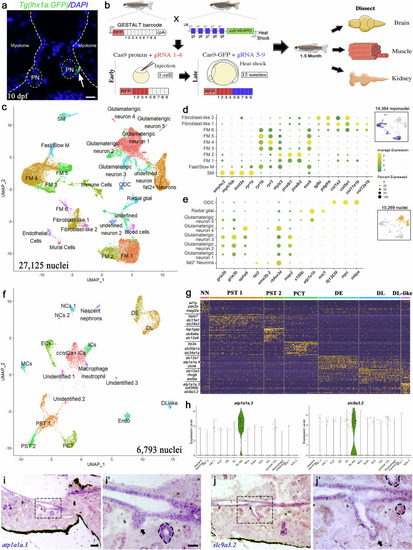
snRNA-Seq identifies various cell types from zebrafish muscle, kidney, and brain.

a Cross-section of 10 dpf zebrafish larvae showing the lhx1a-GFP+ kidney progenitor cells located at the interstitial region between the myotome and pronephros (PN) (scale bar, 20 µm). Representative image from one of three biologically independent larvae (n = 3). b Schematics showing GESTALT barcode editing and tissue harvest protocol for transcriptomes and lineage recordings analysis. c UMAP of 27,125 nuclei clustered into muscle and brain cell types from four biologically independent fish (n = 4). M Muscle; FM fast muscle, SM Slow muscle, ODC oligodendrocyte. d, e Dotplot of gene expression patterns of select marker genes (rows) for identified subcluster (columns) from muscle (n = 14,364 myonuclei) and brain (n = 10,269 nuclei). Dot size represents the percentage of nuclei expressing the marker; color represents the average scaled expression level. Inset highlights (blue and orange) the muscle and brain clusters in (c). f UMAP of 6793 nuclei clustered into kidney cell types from three biologically independent fish (n = 3). EC endothelial cells, MC Mural cells, IC Immune cells, NC kidney neuron cells, PST1 proximal straight tubule 1, PST2 proximal straight tubule 2, PCT Proximal convoluted tubule; DE Distal early tubule; DL Distal late tubule. g Heat map of scaled gene expression of top 20 differentially expressed genes from each nephron segment (Supplementary data 4). Key marker genes for each nephron segment are indicated on the left. NN nascent nephrons. h Violin plot of specific markers of the DL-like tubular population. i Expression of atp1a1a.3 in kidney cross-sections (scale bar, 100 µm). i’ Close-up image of black-dashed box in (i), black-dotted circle demarcates mesonephric tubule expressing atp1a1a.3 (scale bar, 20 µm), Representative image from one of three biologically independent fish kidneys (n = 3). j Expression of slc9a3.2 in kidney cross-sections. j’ Close-up image of black-dashed box in (j), black-dotted circles demarcate mesonephric tubule expressing slc9a3.2, Representative image from one of three biologically independent fish kidneys (n = 3).

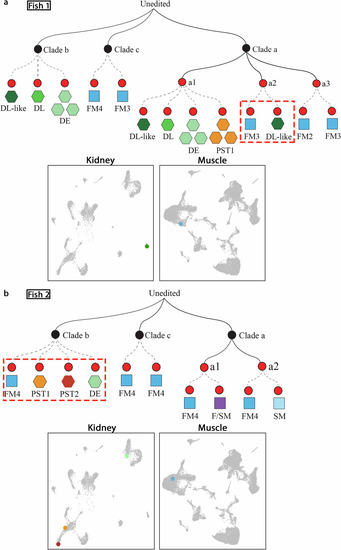
Reconstructed lineage trees reveal linkage between muscle and kidney cells in juvenile zebrafish.

a Mini-tree showing lineage branches of kidney and muscle cells from Fish 1 that share the same barcode (selected branches from Supplementary Fig. 2a). b Mini-tree showing lineage branches of kidney and muscle cells from Fish 2 that share the same barcode (selected branches from Supplementary Fig. 2b). Black nodes represent early edits at barcode sites 1–4; red nodes represent late edits at sites 5–9. Solid black lines indicate inferred lineage relationships between nodes. Dashed lines connect individual cells to shared barcodes. Each shape represents a single cell, color-coded by cell type. Bottom panels show UMAP plots highlighting the corresponding kidney and muscle cells that share the same barcodes (red dashed boxes). PST proximal straight tubule; DE distal early tubule, DL distal late tubule, FM fast muscle, SM slow muscle, F/SM fast/slow muscle.

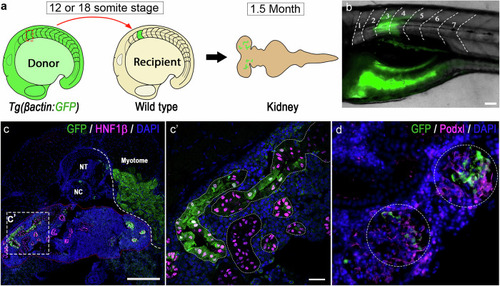
Transplanted GFP+ somite contributed to mesonephric nephrons in recipient fish.

a Schematic of somite transplantation showing a GFP+ donor somite is harvested at 12 (15 hpf) or 18 (18 hpf) somite stage and transplanted into a wild-type recipient embryo at equivalent developmental stage, and kidney of the recipient fish is examined at 1.5-month of the age. b Image of a recipient larvae (6 dpf) developed donor derived GFP+ muscle fibers at the transplantation site (somite 3, transplanted at 12 somite stage). Scale bar, 20 µm. c Cross section of same recipient juvenile fish (at 1.5-month stage) immunostained for GFP and renal tubular marker Hnf1b, showing donor somite contributed tubular structures (Scale bar, 100 µm). c’ Close-up image of the area boxed in c showing Hnf1b+ mesonephric tubules containing donor somite derived GFP+ cells (Scale bar, 20 µm). Similar results were observed in 3 biologically independent recipients with positive contribution (n = 3). d Immunostaining of donor derived Podxl+/GFP+ glomeruli, Scale bar, 20 µm. Similar results were observed in 3 biologically independent recipients with positive contribution (n = 3). For merged images, levels adjustments were applied independently to individual colour channels for clarity. All adjustments were applied equally across the entire image.

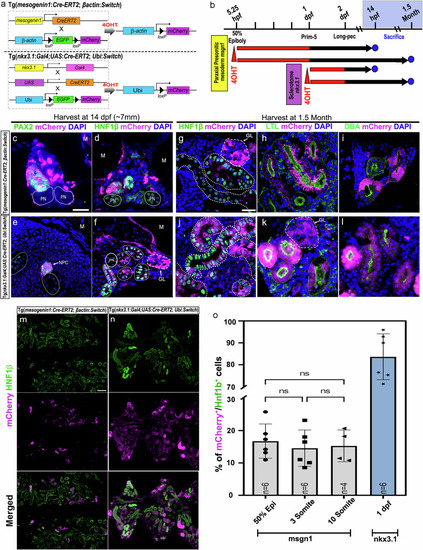
Cre-loxP based lineage-tracing techniques unveil a somitic origin for zebrafish mesonephric nephrons.

a Schematic representation showing the cross between the msgn1:Cre-ERT2 line and bactin:Switch (loxP-EGFP-loxP-mCherry) line, and the nkx3.1:Gal4;UAS:Cre-ERT2 line and Ubi:Switch line, followed by treatment with 10 µM 4-OHT to activate Cre recombinase and induce mCherry expression in targeting cells. b Experimental timeline of 4-OHT treatment in both transgenic lines. c–f Cross-sections of 4-OHT treated 7 mm larvae immunostained for renal markers (Pax2, Hnf1β) and mCherry+ cells. Tg(msgn1:Cre-ERT2;bactin:Switch) (c, d) and Tg(nkx3.1:Gal4; UAS:Cre-ERT2; ubi:Switch) (e, f), (Scale bar, 20 µm); PN: pronephros; M: muscle, NPC: Nephron progenitor clusters; GL: Glomerulus. Images are representative of five biologically independent larvae per transgenic line (n = 5 per line), with similar results. g–l Sections of 4-OHT-treated 1.5-month-old zebrafish kidneys immunostained for renal markers: HNF1β (white dotted outlines), Lotus tetragonolobus lectin (LTL), Dolichos biflorus agglutinin (DBA), and mCherry⁺ cells. Images show donor-derived contributions to the glomerulus (GL; white dashed outlines), proximal tubule (LTL), and distal tubule (DBA) of the nephron. PN, pronephros (solid white outlines). Scale bar, 20 μm. Images are representative of ten biologically independent fish per transgenic line (n = 10 per line), with similar results. m, n Representative low-magnification images of kidney sections from both transgenic lines for quantification. Scale bar, 100 µm. o Quantification of the percentage of mCherry+/Hnf1b+ cells in 1.5-month Tg(msgn1:Cre-ERT2;bactin:Switch) and Tg(nkx3.1:Gal4; UAS:Cre-ERT2; ubi:Switch) fish kidneys. For the msgn1-Cre-ERT2 line, recombination occurred at 50% epiboly, 3-somite, and 10-somite stages, and for the nkx3.1-Gal4-UAS-Cre line, recombination occurred at 1-day post-fertilization (1dpf). Data points correspond to the mean percentage of mCherry+/Hnf1b+ cells ± SEM. Each dataset consists of three sections quantified per fish, with each section 14 μm in thickness, and every fifth section was quantified. Statistical significance was assessed using a two-sided one-way ANOVA followed by Tukey’s post-hoc test; ***P < 0.001. For the 50% epiboly and 3-somite stages, n = 6 fish per time point, for the 10-somite stage, n = 4, and for the 1dpf stage, n = 6. Source data are provided as a Source Data file. For all merged images, levels adjustments were applied independently to individual colour channels for clarity. All adjustments were applied equally across the entire image.

Acknowledgments
This image is the copyrighted work of the attributed author or publisher, and ZFIN has permission only to display this image to its users. Additional permissions should be obtained from the applicable author or publisher of the image. Full text @ Nat. Commun.