IMAGE

Fig. 1

ID
ZDB-IMAGE-250730-30
Source
Figures for Peng et al., 2025
Image
Figure Caption

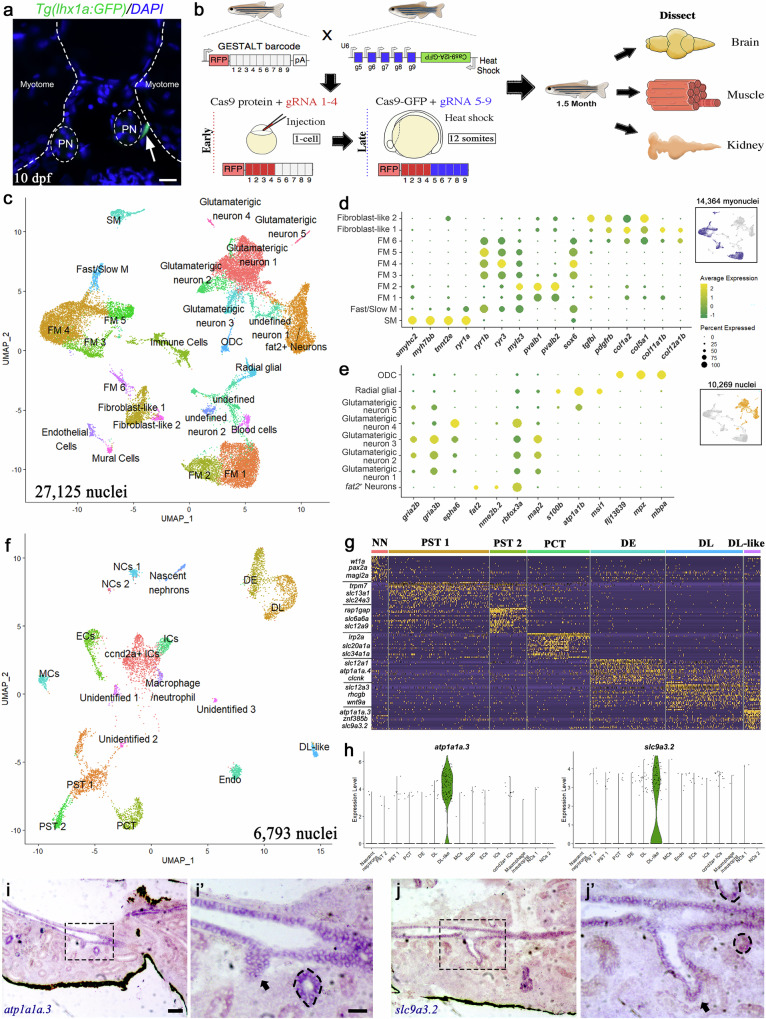
Fig. 1 snRNA-Seq identifies various cell types from zebrafish muscle, kidney, and brain.

a Cross-section of 10 dpf zebrafish larvae showing the lhx1a-GFP+ kidney progenitor cells located at the interstitial region between the myotome and pronephros (PN) (scale bar, 20 µm). Representative image from one of three biologically independent larvae (n = 3). b Schematics showing GESTALT barcode editing and tissue harvest protocol for transcriptomes and lineage recordings analysis. c UMAP of 27,125 nuclei clustered into muscle and brain cell types from four biologically independent fish (n = 4). M Muscle; FM fast muscle, SM Slow muscle, ODC oligodendrocyte. d, e Dotplot of gene expression patterns of select marker genes (rows) for identified subcluster (columns) from muscle (n = 14,364 myonuclei) and brain (n = 10,269 nuclei). Dot size represents the percentage of nuclei expressing the marker; color represents the average scaled expression level. Inset highlights (blue and orange) the muscle and brain clusters in (c). f UMAP of 6793 nuclei clustered into kidney cell types from three biologically independent fish (n = 3). EC endothelial cells, MC Mural cells, IC Immune cells, NC kidney neuron cells, PST1 proximal straight tubule 1, PST2 proximal straight tubule 2, PCT Proximal convoluted tubule; DE Distal early tubule; DL Distal late tubule. g Heat map of scaled gene expression of top 20 differentially expressed genes from each nephron segment (Supplementary data 4). Key marker genes for each nephron segment are indicated on the left. NN nascent nephrons. h Violin plot of specific markers of the DL-like tubular population. i Expression of atp1a1a.3 in kidney cross-sections (scale bar, 100 µm). i’ Close-up image of black-dashed box in (i), black-dotted circle demarcates mesonephric tubule expressing atp1a1a.3 (scale bar, 20 µm), Representative image from one of three biologically independent fish kidneys (n = 3). j Expression of slc9a3.2 in kidney cross-sections. j’ Close-up image of black-dashed box in (j), black-dotted circles demarcate mesonephric tubule expressing slc9a3.2, Representative image from one of three biologically independent fish kidneys (n = 3).

Acknowledgments
This image is the copyrighted work of the attributed author or publisher, and ZFIN has permission only to display this image to its users. Additional permissions should be obtained from the applicable author or publisher of the image. Full text @ Nat. Commun.