IMAGE

Fig. 2

ID
ZDB-IMAGE-250730-31
Source
Figures for Peng et al., 2025
Image
Figure Caption

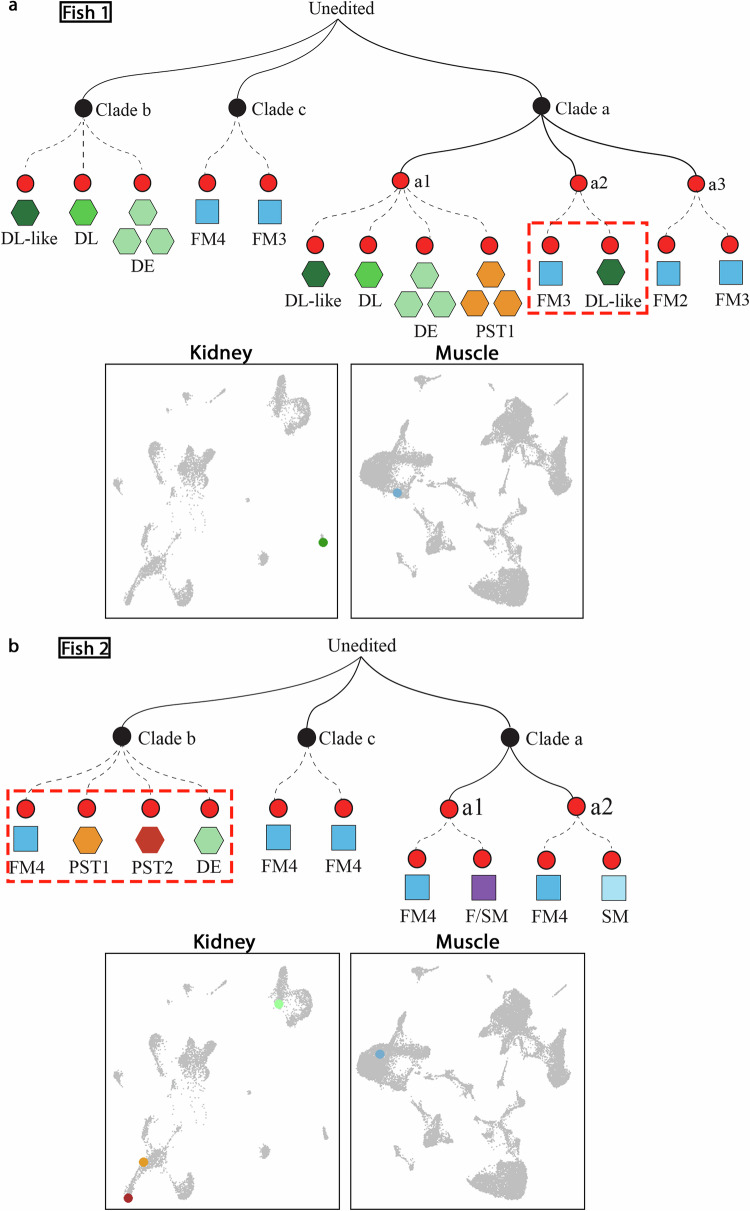
Fig. 2 Reconstructed lineage trees reveal linkage between muscle and kidney cells in juvenile zebrafish.

a Mini-tree showing lineage branches of kidney and muscle cells from Fish 1 that share the same barcode (selected branches from Supplementary Fig. 2a). b Mini-tree showing lineage branches of kidney and muscle cells from Fish 2 that share the same barcode (selected branches from Supplementary Fig. 2b). Black nodes represent early edits at barcode sites 1–4; red nodes represent late edits at sites 5–9. Solid black lines indicate inferred lineage relationships between nodes. Dashed lines connect individual cells to shared barcodes. Each shape represents a single cell, color-coded by cell type. Bottom panels show UMAP plots highlighting the corresponding kidney and muscle cells that share the same barcodes (red dashed boxes). PST proximal straight tubule; DE distal early tubule, DL distal late tubule, FM fast muscle, SM slow muscle, F/SM fast/slow muscle.

Acknowledgments
This image is the copyrighted work of the attributed author or publisher, and ZFIN has permission only to display this image to its users. Additional permissions should be obtained from the applicable author or publisher of the image. Full text @ Nat. Commun.