|
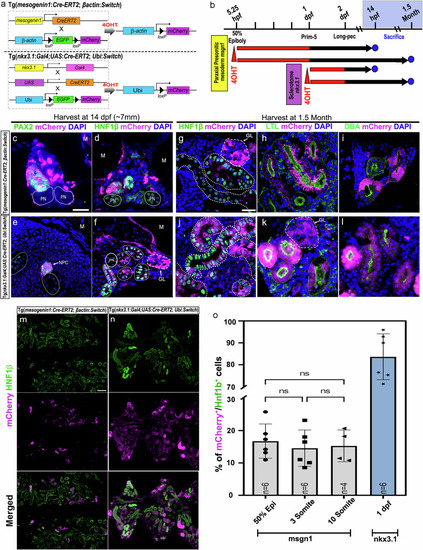
Cre-loxP based lineage-tracing techniques unveil a somitic origin for zebrafish mesonephric nephrons. a Schematic representation showing the cross between the msgn1:Cre-ERT2 line and bactin:Switch (loxP-EGFP-loxP-mCherry) line, and the nkx3.1:Gal4;UAS:Cre-ERT2 line and Ubi:Switch line, followed by treatment with 10 µM 4-OHT to activate Cre recombinase and induce mCherry expression in targeting cells. b Experimental timeline of 4-OHT treatment in both transgenic lines. c–f Cross-sections of 4-OHT treated 7 mm larvae immunostained for renal markers (Pax2, Hnf1β) and mCherry+ cells. Tg(msgn1:Cre-ERT2;bactin:Switch) (c, d) and Tg(nkx3.1:Gal4; UAS:Cre-ERT2; ubi:Switch) (e, f), (Scale bar, 20 µm); PN: pronephros; M: muscle, NPC: Nephron progenitor clusters; GL: Glomerulus. Images are representative of five biologically independent larvae per transgenic line (n = 5 per line), with similar results. g–l Sections of 4-OHT-treated 1.5-month-old zebrafish kidneys immunostained for renal markers: HNF1β (white dotted outlines), Lotus tetragonolobus lectin (LTL), Dolichos biflorus agglutinin (DBA), and mCherry⁺ cells. Images show donor-derived contributions to the glomerulus (GL; white dashed outlines), proximal tubule (LTL), and distal tubule (DBA) of the nephron. PN, pronephros (solid white outlines). Scale bar, 20 μm. Images are representative of ten biologically independent fish per transgenic line (n = 10 per line), with similar results. m, n Representative low-magnification images of kidney sections from both transgenic lines for quantification. Scale bar, 100 µm. o Quantification of the percentage of mCherry+/Hnf1b+ cells in 1.5-month Tg(msgn1:Cre-ERT2;bactin:Switch) and Tg(nkx3.1:Gal4; UAS:Cre-ERT2; ubi:Switch) fish kidneys. For the msgn1-Cre-ERT2 line, recombination occurred at 50% epiboly, 3-somite, and 10-somite stages, and for the nkx3.1-Gal4-UAS-Cre line, recombination occurred at 1-day post-fertilization (1dpf). Data points correspond to the mean percentage of mCherry+/Hnf1b+ cells ± SEM. Each dataset consists of three sections quantified per fish, with each section 14 μm in thickness, and every fifth section was quantified. Statistical significance was assessed using a two-sided one-way ANOVA followed by Tukey’s post-hoc test; ***P < 0.001. For the 50% epiboly and 3-somite stages, n = 6 fish per time point, for the 10-somite stage, n = 4, and for the 1dpf stage, n = 6. Source data are provided as a Source Data file. For all merged images, levels adjustments were applied independently to individual colour channels for clarity. All adjustments were applied equally across the entire image.
|