
- Title
-
Regulation of Hindbrain Vascular Development by rps20 in Zebrafish
- Authors
- Shen, X., Wen, Z., Deng, S., Qiu, Y., Ma, W., Dong, X., Gong, J., Zhang, Y., Liu, D., Xu, B.
- Source
- Full text @ Cells
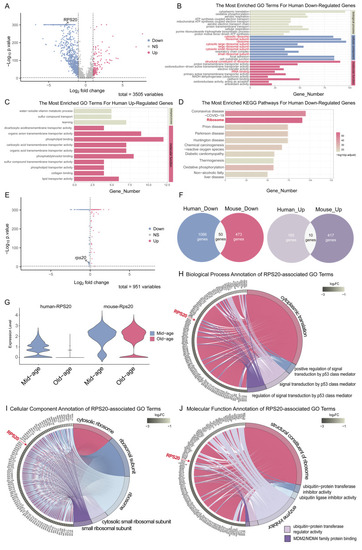
Cross-species bioinformatics identified conserved aging signatures in cerebrovascular endothelial cells. ( |
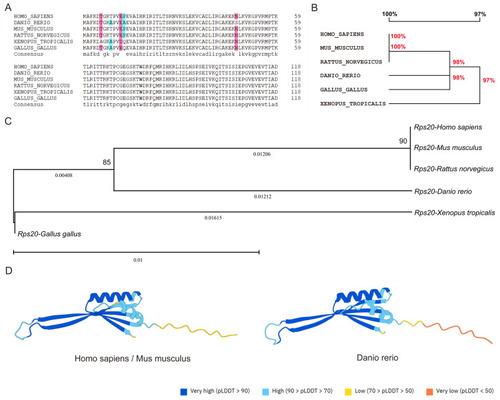
Evolutionary conservation of RPS20 protein in vertebrates. ( |
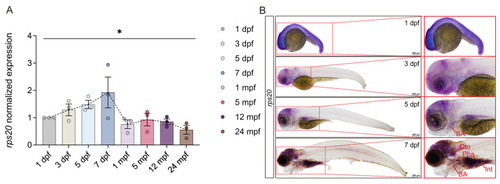
Spatiotemporal expression analysis of |
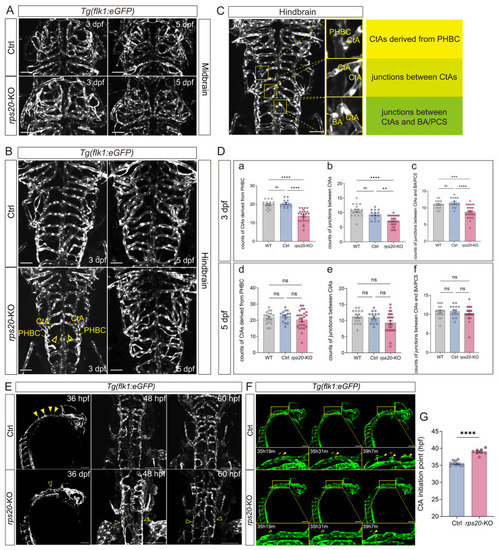
Knockout of |
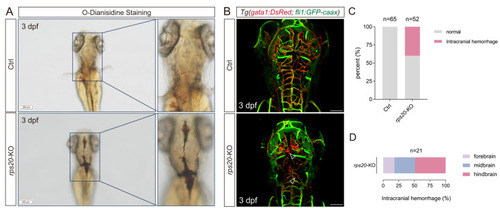
Knockout of |
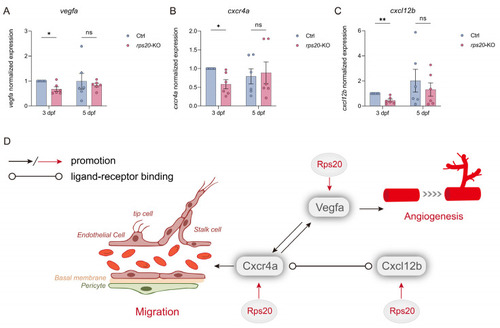
Knockout of |