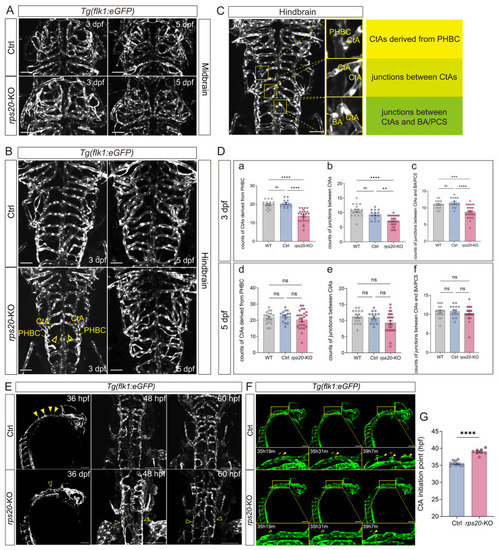
Knockout of rps20 impaired hindbrain vascular development. (A) Representative images showing the midbrain vasculature at 3 dpf and 5 dpf; (B) Representative images showing the hindbrain vasculature at 3 dpf and 5 dpf; (C) Schematic representation of three quantitative parameters for quantifying hindbrain vascular development; (D) Quantitative analysis of hindbrain vasculature at 3 dpf and 5 dpf. At 3 dpf, counts of CtAs derived from PHBC: WT: 19.84 ± 2.1, Ctrl: 20.36 ± 1.9, rps20-KO:13.8 ± 3.4; counts of junctions between CtAs: WT: 10.71 ± 2.1, Ctrl: 9.36 ± 1.7, rps20-KO: 7.16 ± 1.8; counts of junctions between CtAs and BA/PCS: WT: 11.06 ± 1.3, Ctrl: 11.57 ± 1.6, rps20-KO: 8.8 ± 2.1. In both 3 dpf and 5 dpf, 17 WT larvae, 14 Ctrl larvae, and 25 rps20-KO larvae were analyzed; (E) Representative images showing the developmental tracking of central arteries (CtAs). Solid yellow arrowheads indicate sprouting CtAs. Empty yellow arrowheads indicate absence of CtAs; (F) Time-lapse imaging of CtAs sprouting dynamics. Solid yellow arrowheads indicate sprouting CtAs. Empty yellow arrowheads indicate absence of CtAs; (G) Initiation timing of CtAs in control and rps20 knockout zebrafish, 10 sprouting events in ctrl larvae, and 8 sprouting events in rps20-KO larvae were analyzed. Scale bars, 50 μm (A,B), 100 μm (E,F). Data presented as mean ± SEM. Statistical significance determined by one-way ANOVA with Tukey’s Honestly Significant Difference test in figure (D). Statistical significance determined by unpaired Student’s t-test in (G) (** p < 0.01, *** p < 0.001, **** p < 0.0001, ns = no significance).
|
