
- Title
-
Specific oncogene activation of the cell of origin in mucosal melanoma
- Authors
- Babu, S., Chen, J., Baron, C.S., Sun, K., Robitschek, E., McConnell, A.M., Wu, C., Dedeilia, A., Sade-Feldman, M., Modhurima, R., Manos, M.P., Chen, K.Y., Cox, A.M., Ludwig, C.G., Kellis, M., Buchbinder, E.I., Hacohen, N., Yang, J., Boland, G.M., Abraham, B.J., Liu, D., Zon, L.I., Insco, M.L.
- Source
- Full text @ Nat. Commun.
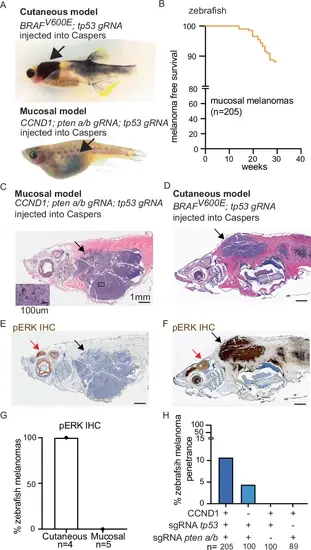
Zebrafish model recapitulates localization of human MM. A Light micrographs of zebrafish melanoma generated from melanocyte-specific expression or CRISPR-deletion in transparent “Casper” zebrafish. Cutaneous model (upper). Mucosal model (lower). B MM free survival of zebrafish with melanocyte-specific expression of human CCND1 and melanocyte-specific CRISPR-deletion of pten a and b and tp53. C–G Zebrafish melanoma histology. CM n = 4, MM n = 5. C, D H&E stain of MM (C) and CM (D). E, F Phospho ERK (pERK) immunohistochemistry (IHC) of MM (E) and CM (F). Scale bar = 1 mm; inset scale bar = 100 μm. Black arrow = tumor, red arrow = brain. G Quantification of % pERK positive zebrafish melanomas. H % zebrafish MM penetrance. n = zebrafish. |
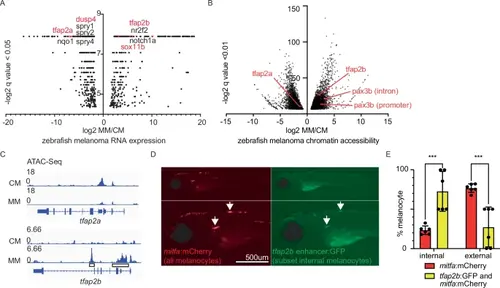
Zebrafish MM has a distinct cellular state from CM. Volcano plots derived from DESeq2 of A bulk RNA-seq from zebrafish MM (n = 5) vs. CM (n = 3) and B ATAC-seq from zebrafish MM (n = 3) vs. CM (n = 3). C IGV plot of ATAC-seq showing chromatin accessibility at tfap2a and tfap2b in zebrafish MM vs. CM. Boxes = loci used for tfap2b reporter. D, E tfap2b enhancer driving GFP preferentially labels internal mitfa-mCherry labeled melanocytes in 6-day old Casper zebrafish. n = 6 zebrafish. D Fluorescent images. Scale bar = 500 μm. E Reporter expression quantification. *** = 0.0003, 2-way ANOVA with multiple comparisons. Mean ± SD. Source data are provided in Source Data Fig. 2E. |
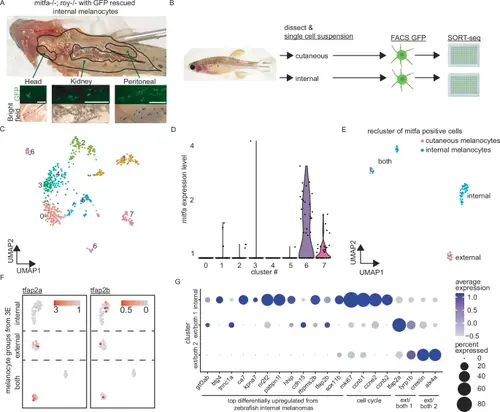
Zebrafish internal melanocytes have properties consistent with MM initiating cells. A Light micrographs demonstrating internal GFP-expressing melanocytes from adult Casper zebrafish. Scale bar = 500 μm. n = 7 zebrafish. B Schematic for single-cell RNA-seq (scRNA-seq) of cutaneous and internal adult zebrafish melanocytes. Cutaneous melanocytes were combined from two zebrafish and mucosal melanocytes were combined from seven zebrafish. Created in BioRender. Insco, M. (2025) https://BioRender.com/da5ul5n. C UMAP of scRNA-seq from GFP-sorted external and internal melanocytes. D mitfa-expressing cells from (C). E UMAP of sub-clustered mitfa+ melanocytes. Blue = from internal. Red = from cutaneous. F tfap2a and tfap2b expression in “internal”, “external”, and “both” melanocyte groups from (E). G Dot plot showing gene expression of top differentially expressed genes from zebrafish MMs for Seurat-defined melanocyte clusters from Fig. S3D. |
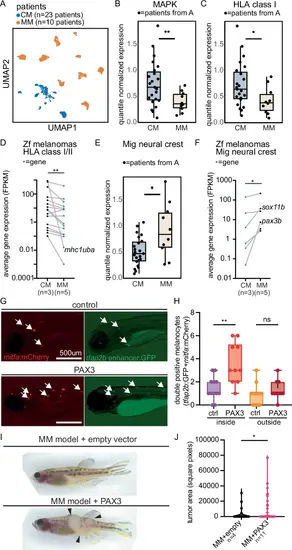
MM cell state is conserved in patients. A UMAP of scRNA-seq from CM patients (n = 23) and MM patients (n = 10). B, C Normalized pseudobulked gene expression in CM vs. MM cells from scRNA-seq for B MAPK target genes, ** = 0.0036, two-sided t-test, and C HLA Class I antigen presentation genes, * = 0.017, two-sided t-test. Dots = patients. D Average gene expression of expressed zebrafish mhc class I/II genes in zebrafish CM vs. MM. Dots = genes. Lines indicate the same gene in both conditions. ** = 0.0017, Wilcoxon matched-pairs rank test. FPKM = fragments per kilobase of transcript per million. E Normalized pseudobulked gene expression in MM vs. CM cells from scRNA-seq for migratory neural crest genes. * = 0.036, two-sided t-test. F Average gene expression (FPKM) of migratory neural crest genes in zebrafish CMs vs. MMs. Dots = genes. Lines indicate the same gene in both conditions. * = 0.031, Wilcoxon matched-pairs rank test. G, H Melanocyte-specific expression of hPAX3 (n = 10) vs. control (n = 12) in Casper zebrafish with labeled internal melanocytes (double positive mitfa-mCherry and tfap2b-GFP) and pigment removal at 6 dpf. G Representative immunofluorescent images. Scale bar = 500 μm. H Quantification of double positive melanocytes inside and outside zebrafish embryos. ** = 0.0014, ns = 0.7813, ordinary one-way ANOVA with multiple comparisons. I, J hPAX3-vs. empty control-expressing zebrafish MM (CCND1; pten a/b gRNA, tp53 gRNA). I Representative images at 23 weeks post-fertilization and J Tumor area quantification (* = 0.048, two-sided t-test). n = tumors. For all box plots, the box is the 25th to 75th percentile range and whiskers show maximum to minimum. For plots (B, C, E) the middle line represents the median. Source data are provided in Source Data Fig. 4. |