
Fig. 4
- ID
- ZDB-FIG-250813-9
- Publication
- Babu et al., 2025 - Specific oncogene activation of the cell of origin in mucosal melanoma
- Other Figures
- All Figure Page
- Back to All Figure Page
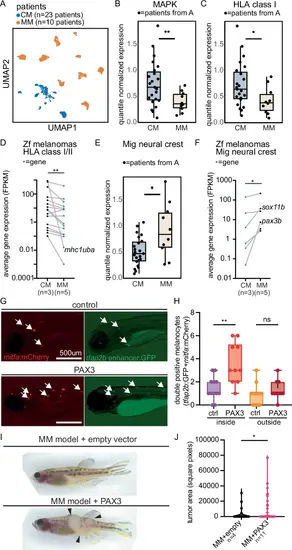
MM cell state is conserved in patients. A UMAP of scRNA-seq from CM patients (n = 23) and MM patients (n = 10). B, C Normalized pseudobulked gene expression in CM vs. MM cells from scRNA-seq for B MAPK target genes, ** = 0.0036, two-sided t-test, and C HLA Class I antigen presentation genes, * = 0.017, two-sided t-test. Dots = patients. D Average gene expression of expressed zebrafish mhc class I/II genes in zebrafish CM vs. MM. Dots = genes. Lines indicate the same gene in both conditions. ** = 0.0017, Wilcoxon matched-pairs rank test. FPKM = fragments per kilobase of transcript per million. E Normalized pseudobulked gene expression in MM vs. CM cells from scRNA-seq for migratory neural crest genes. * = 0.036, two-sided t-test. F Average gene expression (FPKM) of migratory neural crest genes in zebrafish CMs vs. MMs. Dots = genes. Lines indicate the same gene in both conditions. * = 0.031, Wilcoxon matched-pairs rank test. G, H Melanocyte-specific expression of hPAX3 (n = 10) vs. control (n = 12) in Casper zebrafish with labeled internal melanocytes (double positive mitfa-mCherry and tfap2b-GFP) and pigment removal at 6 dpf. G Representative immunofluorescent images. Scale bar = 500 μm. H Quantification of double positive melanocytes inside and outside zebrafish embryos. ** = 0.0014, ns = 0.7813, ordinary one-way ANOVA with multiple comparisons. I, J hPAX3-vs. empty control-expressing zebrafish MM (CCND1; pten a/b gRNA, tp53 gRNA). I Representative images at 23 weeks post-fertilization and J Tumor area quantification (* = 0.048, two-sided t-test). n = tumors. For all box plots, the box is the 25th to 75th percentile range and whiskers show maximum to minimum. For plots (B, C, E) the middle line represents the median. Source data are provided in Source Data Fig. 4. |