
Fig. 2
- ID
- ZDB-FIG-250813-7
- Publication
- Babu et al., 2025 - Specific oncogene activation of the cell of origin in mucosal melanoma
- Other Figures
- All Figure Page
- Back to All Figure Page
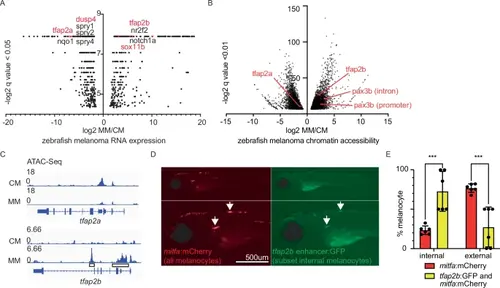
Zebrafish MM has a distinct cellular state from CM. Volcano plots derived from DESeq2 of A bulk RNA-seq from zebrafish MM (n = 5) vs. CM (n = 3) and B ATAC-seq from zebrafish MM (n = 3) vs. CM (n = 3). C IGV plot of ATAC-seq showing chromatin accessibility at tfap2a and tfap2b in zebrafish MM vs. CM. Boxes = loci used for tfap2b reporter. D, E tfap2b enhancer driving GFP preferentially labels internal mitfa-mCherry labeled melanocytes in 6-day old Casper zebrafish. n = 6 zebrafish. D Fluorescent images. Scale bar = 500 μm. E Reporter expression quantification. *** = 0.0003, 2-way ANOVA with multiple comparisons. Mean ± SD. Source data are provided in Source Data Fig. 2E. |