
Fig. 1
- ID
- ZDB-FIG-250813-6
- Publication
- Babu et al., 2025 - Specific oncogene activation of the cell of origin in mucosal melanoma
- Other Figures
- All Figure Page
- Back to All Figure Page
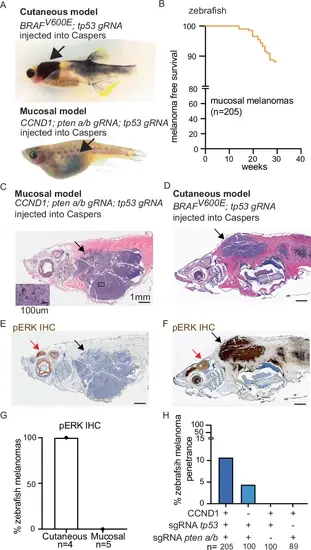
Zebrafish model recapitulates localization of human MM. A Light micrographs of zebrafish melanoma generated from melanocyte-specific expression or CRISPR-deletion in transparent “Casper” zebrafish. Cutaneous model (upper). Mucosal model (lower). B MM free survival of zebrafish with melanocyte-specific expression of human CCND1 and melanocyte-specific CRISPR-deletion of pten a and b and tp53. C–G Zebrafish melanoma histology. CM n = 4, MM n = 5. C, D H&E stain of MM (C) and CM (D). E, F Phospho ERK (pERK) immunohistochemistry (IHC) of MM (E) and CM (F). Scale bar = 1 mm; inset scale bar = 100 μm. Black arrow = tumor, red arrow = brain. G Quantification of % pERK positive zebrafish melanomas. H % zebrafish MM penetrance. n = zebrafish. |