FIGURE SUMMARY
Title

Lurasidone induces developmental toxicity and behavioral impairments in zebrafish embryos

Authors
Li, W., Wang, F., Feng, Z., Cheng, Q., Huang, Y., Zhu, L., Xiao, H., Gong, H.
Source
Full text @ Front Psychiatry

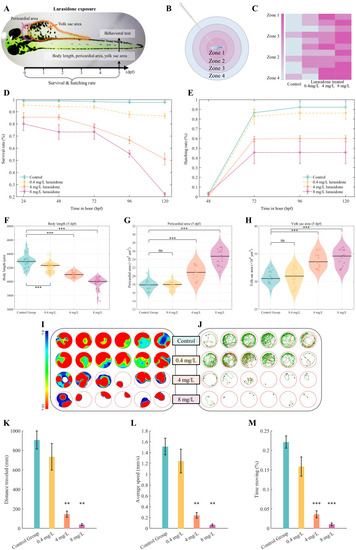
Developmental toxicity assessment of lurasidone exposure on zebrafish embryos. (A) Schematic illustration of the experimental design and morphological parameters measured in this study. (B) Schematic representation of zones and (C) heatmap visualization of touch-response patterns. (D, E) Temporal dynamics of survival and hatching rates from 1 to 5 days post-fertilization (dpf). (F-H) Morphometric analysis at 5 dpf showing body length, pericardial area, and yolk sac area measurements across groups. (I) Zone-specific residence time distribution and (J) representative locomotor trajectories following lurasidone exposure. (K-M) Quantitative behavioral parameters including total distance traveled, average swimming speed, and cumulative active movement duration. Data are presented as mean ± SE; statistical significance: *P < 0.05, **P < 0.01, ***P < 0.001 compared to control group; ns: not significant. No hatching was observed at 24 hours post-fertilization (hpf).

Lurasidone induces dose-dependent neuronal apoptosis in zebrafish embryos. (A) Representative images of 120 hpf zebrafish embryos under differential interference contrast (DIC) and fluorescence microscopy following acridine orange (AO) staining. Embryos were exposed to different concentrations of Lurasidone (0.4, 4, and 8 mg/L) or vehicle control. Apoptosis was visualized by acridine orange staining in live embryos, where apoptotic cells are indicated by green fluorescence, with merged images displaying the anatomical localization of apoptotic signals. (B) Quantitative analysis of relative apoptosis levels (%) across treatment groups. Data are presented as box plots showing median, quartiles, and individual data points (n=12 per group). Statistical significance is indicated by asterisks (***: P < 0.001) compared to control group.

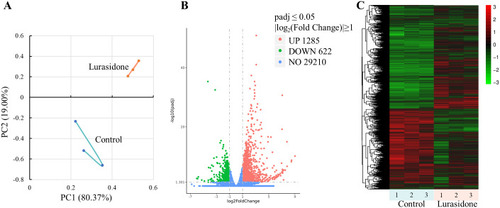
Transcriptome analysis of zebrafish embryos exposed to Lurasidone. (A) Principal component analysis (PCA) showed distinct clustering of control and Lurasidone-treated (4 mg/L) groups based on global gene expression profiles. (B) Volcano plot displaying differentially expressed genes (DEGs). The threshold criteria were set at padj ≤ 0.05 and |log2(Fold Change)| ≥ 1. (C) Hierarchical clustering heatmap of DEGs across all samples.

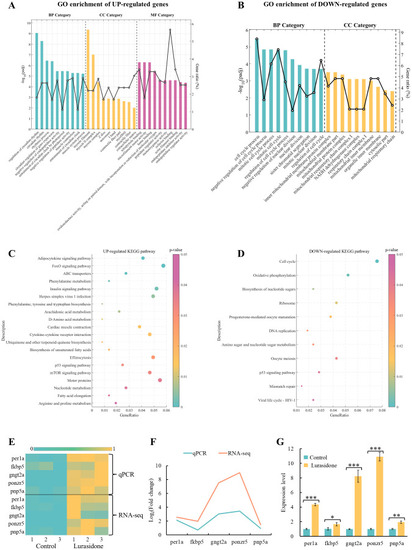
GO enrichment and KEGG pathway analysis of differentially expressed genes (DEGs), and transcriptional and qPCR validation of key genes in Lurasidone-treated zebrafish embryos. (A, B) Top 10 GO terms for up-regulated and down-regulated DEGs categorized into biological processes (BP), molecular functions (MF), and cellular components (CC). Adjusted p-values (padj) were used to assess statistical significance. (C, D) KEGG pathway enrichment analysis of up-regulated and down-regulated DEGs with p-values indicating pathway significance. (E) Heatmap of transcriptomics data displaying normalized expression levels of selected key genes. (F, G) qPCR validation results for the same set of genes, presented as mean ± S.E. with statistical significance denoted as *P < 0.05, **P < 0.01, and ***P < 0.001.

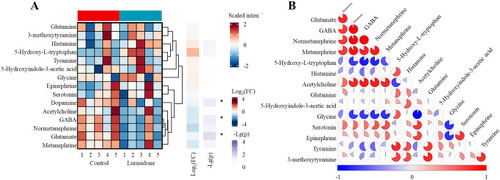
Systematic alterations of 15 neurotransmitters in zebrafish larvae following lurasidone exposure. (A) Hierarchical clustering heatmap showing differential expression patterns of neurotransmitters. (B) Correlation network analysis of neurotransmitter changes. Significance levels: p < 0.05 denoted by *; not marked * indicates not significant]. Data are presented as mean ± SE. (FC: Fold change).

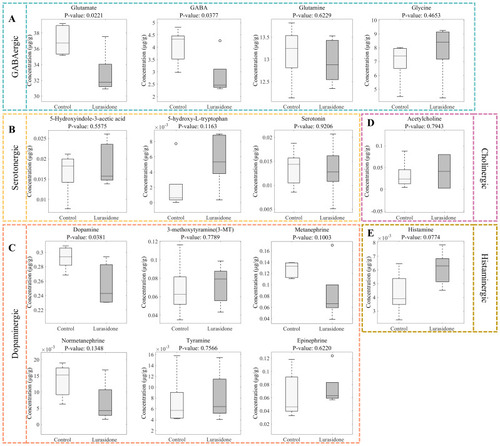
Quantitative analysis of neurotransmitter alterations in zebrafish larvae following lurasidone exposure. (A) Box plots showing changes in GABAergic system components (glutamate, GABA, glutamine, and glycine). (B) Alterations in serotonergic pathway metabolites (5-hydroxyindole-3-acetic acid, 5-hydroxy-L-tryptophan, and serotonin). (C) Changes in dopaminergic system components (dopamine, 3-methoxytyramine, metanephrine, normetanephrine, tyramine, and epinephrine). (D) Effect on cholinergic neurotransmitter (acetylcholine). (E) Impact on histaminergic system (histamine). P-values were calculated using Student’s t-test. Data are presented as mean ± SE.

Acknowledgments
This image is the copyrighted work of the attributed author or publisher, and ZFIN has permission only to display this image to its users. Additional permissions should be obtained from the applicable author or publisher of the image. Full text @ Front Psychiatry