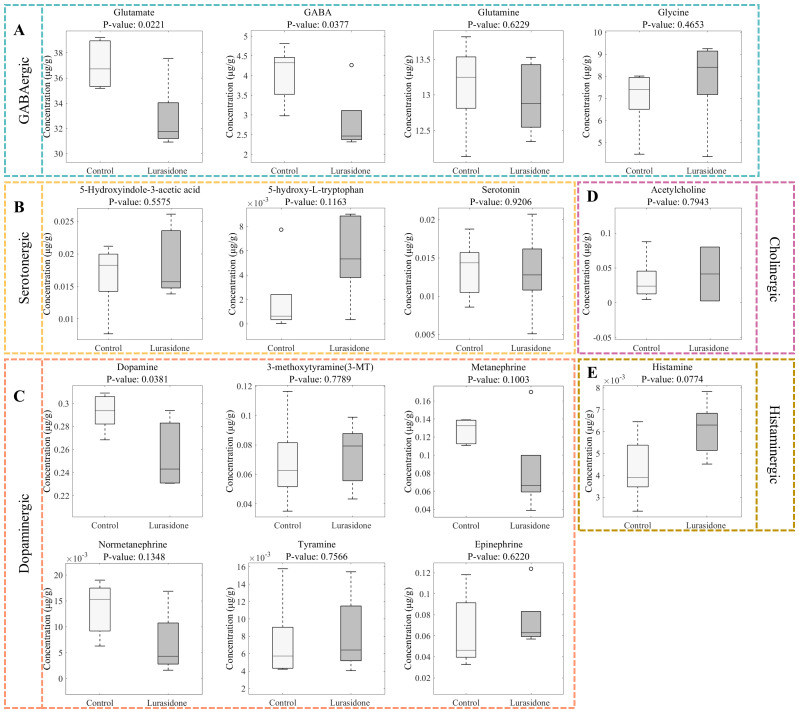
IMAGE

Figure 6

ID
ZDB-IMAGE-250716-87
Source
Figures for Li et al., 2025
Image
Figure Caption

Figure 6

Quantitative analysis of neurotransmitter alterations in zebrafish larvae following lurasidone exposure. (A) Box plots showing changes in GABAergic system components (glutamate, GABA, glutamine, and glycine). (B) Alterations in serotonergic pathway metabolites (5-hydroxyindole-3-acetic acid, 5-hydroxy-L-tryptophan, and serotonin). (C) Changes in dopaminergic system components (dopamine, 3-methoxytyramine, metanephrine, normetanephrine, tyramine, and epinephrine). (D) Effect on cholinergic neurotransmitter (acetylcholine). (E) Impact on histaminergic system (histamine). P-values were calculated using Student’s t-test. Data are presented as mean ± SE.

Acknowledgments
This image is the copyrighted work of the attributed author or publisher, and ZFIN has permission only to display this image to its users. Additional permissions should be obtained from the applicable author or publisher of the image. Full text @ Front Psychiatry