FIGURE

Figure 4

ID
ZDB-FIG-250716-84
Publication
Li et al., 2025 - Lurasidone induces developmental toxicity and behavioral impairments in zebrafish embryos
Other Figures
All Figure Page
Back to All Figure Page
Figure 4

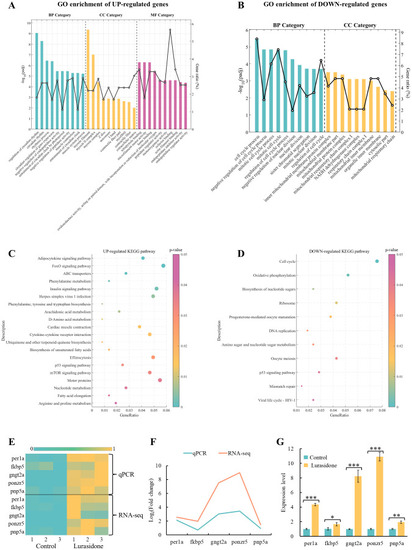
GO enrichment and KEGG pathway analysis of differentially expressed genes (DEGs), and transcriptional and qPCR validation of key genes in Lurasidone-treated zebrafish embryos. (A, B) Top 10 GO terms for up-regulated and down-regulated DEGs categorized into biological processes (BP), molecular functions (MF), and cellular components (CC). Adjusted p-values (padj) were used to assess statistical significance. (C, D) KEGG pathway enrichment analysis of up-regulated and down-regulated DEGs with p-values indicating pathway significance. (E) Heatmap of transcriptomics data displaying normalized expression levels of selected key genes. (F, G) qPCR validation results for the same set of genes, presented as mean ± S.E. with statistical significance denoted as *P < 0.05, **P < 0.01, and ***P < 0.001.

Expression Data

Expression Detail
Antibody Labeling
Phenotype Data

Phenotype Detail
Acknowledgments
This image is the copyrighted work of the attributed author or publisher, and ZFIN has permission only to display this image to its users. Additional permissions should be obtained from the applicable author or publisher of the image. Full text @ Front Psychiatry