FIGURE SUMMARY
Title

Group B Streptococci lyse endothelial cells to infect the brain in a zebrafish meningitis model

Authors
Ravishankar, S., Tuohey, S.M., Ramos, N.O., Uchiyama, S., Hayes, M.I., Kang, K., Nizet, V., Madigan, C.A.
Source
Full text @ PLoS Biol.

GBS infects the brain of zebrafish larvae in a time- and inoculum-dependent manner.

(A) Diagram of zebrafish caudal vein injection (left). Green fluorescent GBS-GFP infected larva at 20 hours post infection (hpi) (right). White arrowheads, GBS infection in the brain. Yellow arrowheads, GBS infection in the body. (B) GBS burden per larva infected with 50 or 250 CFU at 0–24 hpi, quantified by fluorescent pixel count (FPC). n = 24 larvae per group. Horizontal bars, means; Student t test. Representative of 2 independent experiments. (C) 72-h survival curve of zebrafish larvae injected with 20–500 CFU GBS. n = 24 larvae per group; Kaplan–Meier test, compared to PBS-injected group. Representative of 3 independent experiments. (D) Representative images of the same larva head, infected with 220 CFU GBS-GFP, at 0, 12, 16, and 24 hpi. White arrowheads, GBS infection in brain. (E) Proportion of larvae with GBS-infected brains with 50 CFU (black) or 250 CFU (white) inoculum at 0, 12, 16, and 24 hpi. n = 24 larvae per group; ns: not significant, Fisher’s exact test. Representative of 2 independent experiments. (F) Representative images of larvae infected with 300 CFU wildtype (WT) GBS-GFP, or 1,000 CFU ∆iagA GBS-GFP. (G) 48-hour survival curve of larvae infected with wildtype GBS-GFP or 1,000 CFU ∆iagA GBS-GFP. n = 24 larvae per group; Kaplan–Meier test, compared to wildtype group. Representative of 3 independent experiments. (H) GBS burden per larva infected with 100 CFU wildtype or 1,000 CFU ∆igaA at 24 hpi, quantified by FPC. Horizontal bars, means; Student t test. Scale bar, 100 µm throughout. All underlying data in Fig 1 can be found in the supplemental Excel file entitled “S1 Data”.

GBS does not use transcytosis or phagocytes to cross the BBB.

(A) Representative confocal images of red fluorescent brain vasculature in 20 hpi larvae infected with approximately 100 CFU GBS-GFP. White dashed box, GBS microcolony at a vessel bifurcation. Yellow dashed box, GBS microcolony in a straight vessel. Scale bars, 10 µm. (B) Proportion of GBS microcolonies at brain blood vessel bifurcations compared to expected hypothetical values; Fisher’s exact test. Representative of 2 independent experiments. (C) Sequential images from a time-lapse movie, showing a GBS-GFP microcolony clearing from a brain blood vessel. T, hours: minutes after start of time-lapse video recording. Scale bar, 10 µm. (D) Total GBS microcolonies in the brain over time (11–19 hpi) for a representative larva. (E) Representative confocal image (xy) with optical cross sections (yz and zx) of red fluorescent vessels in a 20 hpi larva infected with approximately 100 CFU GBS-GFP. White arrowhead, lack of co-localization of red and green fluorescence because GBS microcolony is in the blood vessel lumen and not the endothelial cell. Scale bar, 10 µm. (F) Proportion of vessels containing GBS in the lumen that are not inside of endothelial cells (EC) (black), or GBS inside of an endothelial cell (white) at 20 hpi. Representative of 3 independent experiments. (G) Representative confocal images of larvae brains with red fluorescent blood vessels infected with approximately 100 CFU GBS-GFP at 20 hpi, without dynasore treatment (top) and with 40 µM dynasore treatment (bottom). White arrowheads, GBS entering the brain. Scale bar, 10 µm. (H) Proportion of larvae with GBS in the brain, with or without dynasore treatment; ns: not significant, Fisher’s exact test. (I) Representative images of a 3 dpf larva with red fluorescent monocytes, intravenously injected at 2 dpf with PBS (top) or lipoclodronate (LC, bottom). Insets show monocytes in the caudal hematopoietic tissue. Scale bar, 100 µm. (J) Monocyte fluorescence per larva intravenously injected with PBS (left) or LC (right), quantified by FPC. Horizontal bars, means; Student t test. Representative of 2 independent experiments. (K) Representative images of a 20 hpi larva infected at 3 dpf with 100 CFU GBS-GFP and injected at 2 dpf with PBS (top) or LC (bottom). White arrowhead, GBS infection in brain. Scale bar, 100 µm. (L) GBS burden per larva at 20 hpi, intravenously injected with PBS or LC, quantified by FPC. Horizontal bars, means; ns: not significant, Student t test. (M) Representative confocal images of brains of 20 hpi larvae infected with approximately 100 CFU GBS-GFP. Larvae were injected with PBS (left) or LC (right). Scale bar, 10 µm. (N) Quantification of the volume of GBS in larvae brains after injection with PBS or LC. Horizontal bars, means; ns: not significant, Student t test. (O) Proportion of larvae with GBS in the brain, with or without LC treatment; ns: not significant, Fisher’s exact test. (P) Representative confocal images of red fluorescent brain vasculature and blue fluorescent polymorphonuclear (PMN) neutrophils in a 20 hpi larva infected with approximately 100 CFU GBS-GFP. White arrowhead, neutrophil in the brain, containing GBS. Yellow arrowhead, GBS entering brain without an associated neutrophil. Gray arrowheads, uninfected neutrophil in the brain. Scale bar, 10 µm. (Q) Proportion of larvae with neutrophils associated with GBS entering the brain. All underlying data in Fig 2 can be found in the supplemental Excel file entitled “S1 Data”.

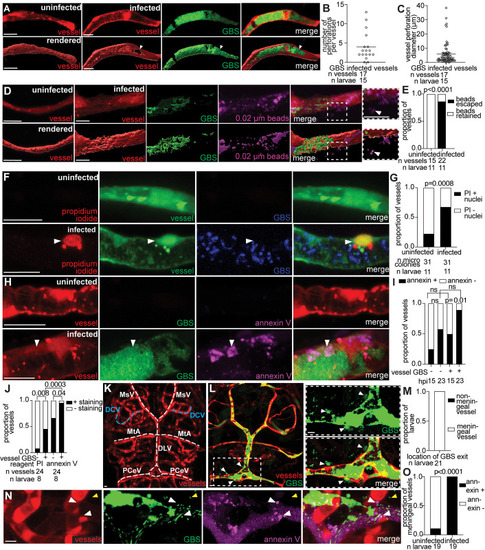
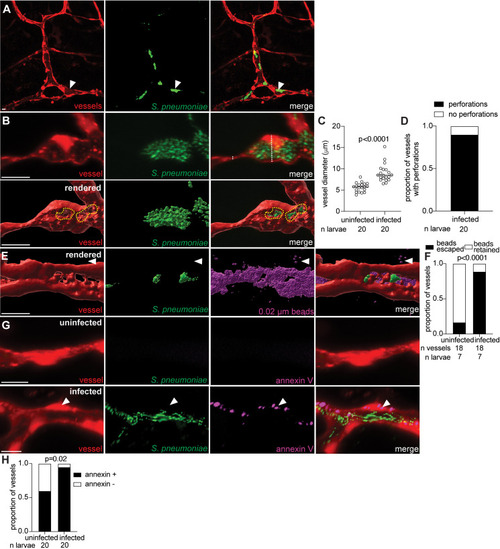
GBS lyses leptomeningeal endothelial cells to enter the brain.

(A) Representative confocal image (top) and 3D rendering (bottom) of an uninfected (left) and infected brain blood vessel (right), from a 20 hpi larva with red fluorescent blood vessels infected with approximately 100 CFU GBS-GFP. White arrowhead, perforation in vessel at the microcolony site. (B) Quantification of the number of perforations per GBS-infected vessel from larva in (A). Horizontal bar, mean. Representative of 3 independent experiments. (C) Maximum diameter of vessel perforations formed at GBS microcolonies from larvae in (A). Horizontal bar, mean. Representative of 3 independent experiments. (D) Representative confocal image (top) and 3D rendering (bottom) of an uninfected (left) and infected brain blood vessel (right, red fluorescent) from 20 hpi larvae infected with approximately 100 CFU GBS-GFP and injected intravenously with far red fluorescent 0.02 µm latex beads (pseudocolored magenta) just prior to imaging. Inset and white arrowhead, beads leaking from infected vessel. (E) Proportion of vessels with retained beads or beads escaped into brain, in uninfected and infected vessels in larvae in (D); Fisher’s exact test. Representative of 3 independent experiments. (F) Representative confocal images of an uninfected (top) and infected green fluorescent brain blood vessel (bottom) from a 20 hpi larva infected with approximately 100 CFU blue fluorescent wildtype GBS-eBFP and injected intravenously with red fluorescent propidium iodide (PI) just prior to imaging. White arrowhead, PI-positive endothelial cell nucleus. (G) Proportion of uninfected and GBS-infected vessels with PI-positive nuclei; Fisher’s exact test. Representative of 3 independent experiments. (H) Representative confocal images of an uninfected (top) and infected (bottom) red fluorescent brain blood vessel from 20 hpi larvae infected with approximately 100 CFU GBS-GFP and injected intravenously with annexin V-Cy5 (pseudocolored magenta). White arrowhead, positive annexin V staining in vessel endothelial cell. (I) Proportion of uninfected and GBS infected vessels with positive annexin V staining, at 15 and 23 hpi; ns: not significant, Fisher’s exact test. Representative of 4 independent experiments. (J) Proportion of uninfected and GBS infected vessels with PI-positive nuclei or positive annexin V staining; Fisher’s exact test. (K) Representative confocal image of brain blood vessels (red fluorescent). White dashed lines indicate leptomeningeal vessels: posterior cerebral vein (PCeV), dorsal longitudinal vein (DLV), mesencephalic vein (MsV), and metencephalic artery (MtA). Blue dashed line, a non-leptomeningeal control vessel, the dorsal ciliary vein (DCV). (L) Representative confocal images of approximately 100 CFU GBS-GFP exiting a red fluorescent leptomeningeal vessel. Inset and white arrowheads, GBS in the brain after exiting the vessel. (M) Proportion of larvae with GBS exiting a leptomeningeal vessel to enter the brain. (N) Representative confocal image of an infected red fluorescent brain blood vessel from a 24 hpi larva infected with approximately 100 CFU wildtype GBS-GFP and injected intravenously with annexin V (pseudocolored magenta). White arrowheads, positive annexin V staining in vessel endothelial cell where GBS is exiting the vessel. Yellow arrowheads, GBS in the brain. (O) Proportion of larvae with positive annexin V staining in leptomeningeal vessels where GBS was exiting compared to uninfected vessels; Fisher’s exact test. Scale bar, 10 µm throughout. All underlying data in Fig 3 can be found in the supplemental Excel file entitled “S1 Data”.

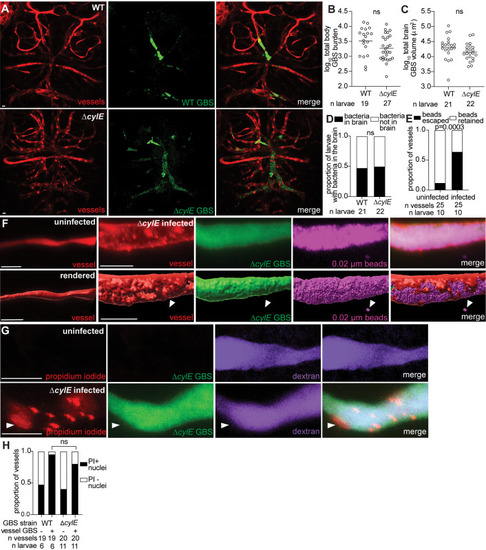
Endothelial cell lysis occurs independently of the primary GBS cytolysin, cylE.

(A) Representative confocal images of red fluorescent brain vasculature in 20 hpi larvae infected with approximately 50 CFU wildtype (WT) GBS-GFP (top), or approximately 150 CFU ∆cylE GBS-GFP (bottom). (B) Wildtype or ∆cylE burden per larva at 20 hpi quantified by FPC. Horizontal bars, means; ns: not significant, Student t test. Representative of 3 independent experiments. (C) Quantification of total GBS volume in the brain of wildtype or ∆cylE GBS infected larvae. Horizontal bars, means; ns: not significant, Student t test. Representative of 3 independent experiments. (D) Proportion of wildtype or ∆cylE GBS-infected larvae with GBS in the brain; ns: not significant, Fisher’s exact test. Representative of 3 independent experiments. (E) Proportion of uninfected or ∆cylE GBS-infected vessels with beads escaped or retained in the vessels; Fisher’s exact test. (F) Representative confocal image (top) and 3D rendering (bottom) of an uninfected (left) and infected (right) brain blood vessel from a 20 hpi larva infected with approximately 150 CFU ∆cylE GBS-GFP and injected intravenously with 0.02 µm far red beads (pseudocolored magenta). White arrowheads, escaped beads. (G) Representative confocal images of an uninfected (top) and infected (bottom) purple fluorescent (from injected dextran, pseudocolored magenta) brain blood vessel. Larvae were infected with approximately 150 CFU ∆cylE GBS-GFP and injected intravenously with red fluorescent propidium iodide (PI) just prior to imaging at 20 hpi. White arrowhead, PI positive endothelial cell nucleus. (H) Proportion of uninfected and wildtype or ∆cylE GBS infected vessels with PI-positive nuclei; ns: not significant, Fisher’s exact test. Scale bar, 10 µm throughout. All underlying data in Fig 4 can be found in the supplemental Excel file entitled “S1 Data”.

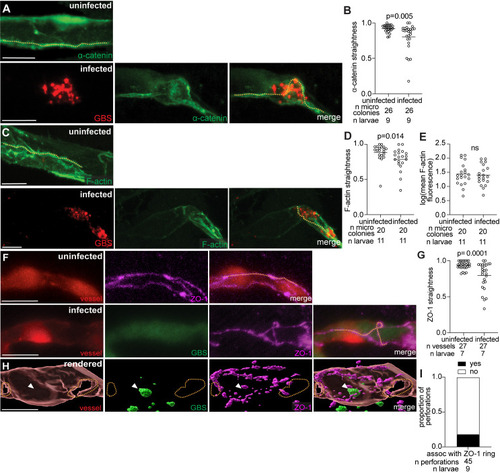
Blood–brain barrier tight and adherens junction proteins are likely disrupted during GBS infection due to endothelial cell lysis.

(A) Representative confocal images of an uninfected (top) and infected (bottom) brain blood vessel with green fluorescent α-catenin from 20 hpi larvae infected with approximately 100 CFU GBS-mCherry. Yellow dashed line, α-catenin border. (B) α-catenin straightness in uninfected and GBS-infected vessels at 20 hpi. Horizontal bars, means; Paired t test. (C) Representative confocal images of an uninfected (top) and infected (bottom) brain blood vessel with green fluorescent F-actin from 20 hpi larvae infected with approximately 100 CFU GBS-mCherry. Yellow dashed line, F-actin border. (D) F-actin straightness in uninfected and GBS-infected vessels at 20 hpi. Horizontal bars, means; Paired t test. (E) Mean F-actin fluorescence in uninfected and GBS-infected vessels at 20 hpi. Horizontal bars, means; ns: not significant, Paired t test. (F) Representative confocal images of an uninfected (top) and infected (bottom) red fluorescent brain blood vessel from 20 hpi larvae infected with approximately 100 CFU GBS-GFP and fixed and stained with a ZO-1 Alexa647 antibody. Yellow dashed line, ZO-1 border. (G) ZO-1 straightness in uninfected and GBS-infected vessels at 20 hpi. Horizontal bars, means; Paired t test. (H) 3D rendering of an uninfected (top) and GBS-infected (bottom) brain blood vessel from a 20 hpi larva infected with approximately 100 CFU GBS-GFP and fixed and stained with a ZO-1 Alexa647 antibody. Yellow dashed lines, outline of the vessel perforation. White arrowhead, GBS microcolony. (I) Proportion of vessel perforations (in infected vessels) that are associated with a ZO-1 ring. Scale bar, 10 µm throughout. All underlying data in Fig 5 can be found in the supplemental Excel file entitled “S1 Data”.

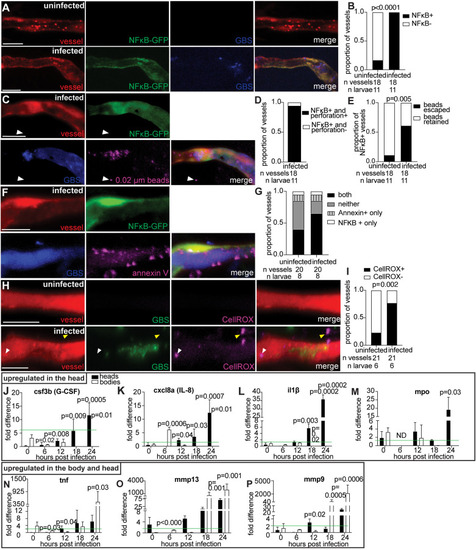
Upregulation of proinflammatory markers suggests host responses contribute to GBS brain invasion.

(A) Representative confocal images of uninfected (top), and infected (bottom) red fluorescent vessels from NFκB-GFP larvae at 20 hpi with approximately 100 CFU blue fluorescent GBS-eBFP. (B) Proportion of uninfected and GBS-infected vessels that are positive for NFκB; Fisher’s exact test. Representative of 2 independent experiments. (C) Representative confocal images of an infected red fluorescent vessel from a NFκB-GFP larva at 20 hpi with approximately 100 CFU blue fluorescent GBS-eBFP and intravenously injected with 0.02 µm beads (pseudocolored magenta). White arrowhead, escaped beads. (D) Proportion of GBS-infected vessels that are positive for NFκB and have vessel perforations, compared to those that lack vessel perforations. (E) Proportion of uninfected and GBS-infected vessels that are positive for NFκB and are also associated with 0.02 µm beads escaping; Fisher’s exact test. (F) Representative confocal images of an infected red fluorescent vessel from a NFκB-GFP larva at 20 hpi with approximately 100 CFU blue fluorescent GBS-eBFP and intravenously injected with annexin V (pseudocolored magenta). (G) Proportion of uninfected and GBS-infected vessels that are positive for NFκB only, positive for annexin V staining only, positive for both, or positive for neither. (H) Representative confocal images of an uninfected (top) and infected brain blood vessel (bottom) from 20 hpi larvae infected with approximately 100 CFU GBS-GFP and injected intravenously with CellROX oxidation sensor (pseudocolored magenta) just prior to imaging. White arrowhead, positive CellROX staining in vessel. Yellow arrowhead, positive CellROX staining outside the vessel endothelial cell. (I) Proportion of uninfected or GBS-infected vessels that are positive for CellROX staining; Fisher’s exact test. (J–P) qPCR mRNA abundance fold change at 0, 6, 12, 18, and 24 hpi for heads and bodies of infected larvae, compared to PBS-injected control larvae for: (J) csf3b (G-CSF) (K) cxcl8a (IL-8), (L) il1β, (M) MPO, (N) TNF, (O) MMP13, and (P) MMP9. Green line, threshold for significantly upregulated genes compared to PBS-injected larvae. ND, no data; Student t test, compared to the 0-h time point. Scale bar, 10 µm throughout. All underlying data in Fig 6 can be found in the supplemental Excel file entitled “S1 Data”.

GBS microcolonies distort vessels and form obstructions.

(A) Representative confocal image of a bifurcated blood vessel in a 20 hpi larva infected with approximately 100 CFU GBS-GFP, showing the uninfected contralateral vessel (left) and infected vessel (right). White dashed lines, diameter of the vessel. (B) Quantification of vessel dilation (µm) at the microcolony for infected vessels compared to uninfected vessels from the same animal at 20 hpi. Horizontal bars, means; paired t test. Representative of 2 independent experiments. (C) Quantification of vessel constriction (µm) adjacent to the microcolony for infected vessels compared to uninfected vessels from the same animal at 20 hpi. Horizontal bars, means; paired t test. Representative of 2 independent experiments. (D) Quantification of vessel diameter (µm) over time (4–11 hpi) for GBS infected and uninfected vessels; Student t test. (E) Representative confocal image of a brain blood vessel infected with approximately 100 CFU GBS-GFP from a 20 hpi gata1:dsRed larva, with red fluorescent red blood cells collecting at the microcolony. Larvae were injected intravenously with far red fluorescent dextran to visualize vessel perfusion (pseudocolored magenta) just prior to imaging. White arrowhead, absence of dextran perfusion in vessel. (F) Representative confocal image of a brain blood vessel infected with approximately 100 CFU red fluorescent GBS-mCherry (pseudocolored green) from a 20 hpi larva, with a green fluorescent platelet (pseudocolored red) attached to the microcolony. Larva was injected intravenously with far red fluorescent dextran to visualize perfusion (pseudocolored magenta). White arrowhead, lack of dextran in vessel. (G) Representative confocal images of larvae brains with red fluorescent red blood cells infected with approximately 100 CFU GBS-GFP at 20 hpi, without warfarin (top) and with 31.25 µM warfarin (bottom). White arrowhead, a red blood cell trapped in a brain blood vessel GBS microcolony. (H) Quantification of the number of obstructions associated with a GBS microcolony in larvae with or without warfarin at 18 hpi. Red blood cells (RBCs). Horizontal bars, means; Student t test. Representative of 2 independent experiments. (I) GBS burden per larva at 20 hpi, treated at 3 dpf with or without warfarin, quantified by FPC. Horizontal bars, means; Student t test. (J) Representative confocal image of a larva brain with fluorescent red blood vessels and GBS-GFP exiting a vessel to enter the brain. Inset shows area of the brain where GBS is entering the brain though a blood vessel. White arrowheads, GBS that has crossed the blood–brain barrier to enter the brain. (K) Proportion of larvae with or without GBS in the brain, with or without warfarin treatment, at 18 hpi; Fisher’s exact test. Representative of 2 independent experiments. (L) 30 hpi survival curve of larvae with and without GBS infection, and with and without warfarin treatment; Kaplan–Meier test, compared to infected, untreated group. Representative of 3 independent experiments. Scale bar, 10 µm throughout. All underlying data in Fig 7 can be found in the supplemental Excel file entitled “S1 Data”.

Streptococcus pneumoniae perforates blood vessels to invade the brain in zebrafish larvae.

(A) Representative confocal image of red fluorescent brain vasculature in a 24 hpi larva infected with approximately 1,000 CFU green fluorescent S. pneumoniae D39 (SPN-GFP). White arrowhead, SPN microcolony in vessel. (B) Representative confocal image (top) and 3D rendering (bottom) of an infected red fluorescent brain blood vessel, from a 24 hpi larva infected with approximately 1,000 CFU SPN-GFP. White dashed line, diameter of vessel. Yellow dashed circle, border of a vessel perforation at the microcolony site. (C) Quantification of vessel diameter (µm) at the SPN microcolony for infected vessels compared to contralateral uninfected vessels from the same animal at 24 hpi. Horizontal bars, means; paired t test. (D) Proportion of SPN-infected vessels with perforations. (E) Representative confocal image of 3D rendered red fluorescent brain blood vessels from 24 hpi larvae infected with approximately 1,000 CFU SPN-GFP and injected intravenously with far red fluorescent 0.02 µm beads (pseudocolored magenta). White arrowhead, escaped beads. (F) Proportion of vessels with retained beads or escaped beads in the brain, in uninfected and infected vessels from larvae in (E); Fisher’s exact test. (G) Representative confocal images of an uninfected (top) or infected red fluorescent brain blood vessel (bottom) from a 24 hpi larva infected with approximately 1,000 CFU SPN-GFP and injected intravenously with annexin V (pseudocolored magenta). White arrowhead, positive annexin V staining in vessel endothelial cell. (H) Proportion of uninfected and SPN-infected vessels with positive annexin V staining at 24 hpi; Fisher’s exact test. Scale bar, 10 µm throughout. All underlying data in Fig 8 can be found in the supplemental Excel file entitled “S1 Data”.

Acknowledgments
This image is the copyrighted work of the attributed author or publisher, and ZFIN has permission only to display this image to its users. Additional permissions should be obtained from the applicable author or publisher of the image. Full text @ PLoS Biol.