|
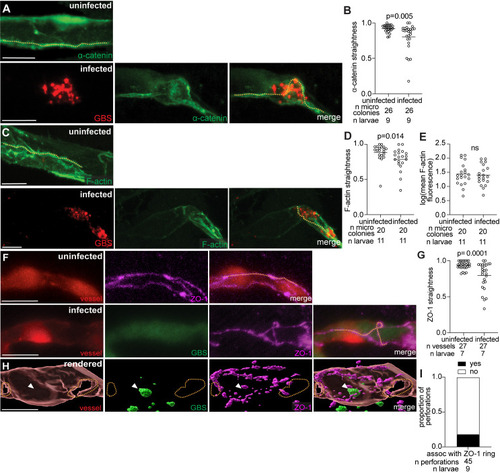
Blood–brain barrier tight and adherens junction proteins are likely disrupted during GBS infection due to endothelial cell lysis. (A) Representative confocal images of an uninfected (top) and infected (bottom) brain blood vessel with green fluorescent α-catenin from 20 hpi larvae infected with approximately 100 CFU GBS-mCherry. Yellow dashed line, α-catenin border. (B) α-catenin straightness in uninfected and GBS-infected vessels at 20 hpi. Horizontal bars, means; Paired t test. (C) Representative confocal images of an uninfected (top) and infected (bottom) brain blood vessel with green fluorescent F-actin from 20 hpi larvae infected with approximately 100 CFU GBS-mCherry. Yellow dashed line, F-actin border. (D) F-actin straightness in uninfected and GBS-infected vessels at 20 hpi. Horizontal bars, means; Paired t test. (E) Mean F-actin fluorescence in uninfected and GBS-infected vessels at 20 hpi. Horizontal bars, means; ns: not significant, Paired t test. (F) Representative confocal images of an uninfected (top) and infected (bottom) red fluorescent brain blood vessel from 20 hpi larvae infected with approximately 100 CFU GBS-GFP and fixed and stained with a ZO-1 Alexa647 antibody. Yellow dashed line, ZO-1 border. (G) ZO-1 straightness in uninfected and GBS-infected vessels at 20 hpi. Horizontal bars, means; Paired t test. (H) 3D rendering of an uninfected (top) and GBS-infected (bottom) brain blood vessel from a 20 hpi larva infected with approximately 100 CFU GBS-GFP and fixed and stained with a ZO-1 Alexa647 antibody. Yellow dashed lines, outline of the vessel perforation. White arrowhead, GBS microcolony. (I) Proportion of vessel perforations (in infected vessels) that are associated with a ZO-1 ring. Scale bar, 10 µm throughout. All underlying data in Fig 5 can be found in the supplemental Excel file entitled “S1 Data”.
|