IMAGE

Fig 6

ID
ZDB-IMAGE-250711-16
Source
Figures for Ravishankar et al., 2025
Image
Figure Caption

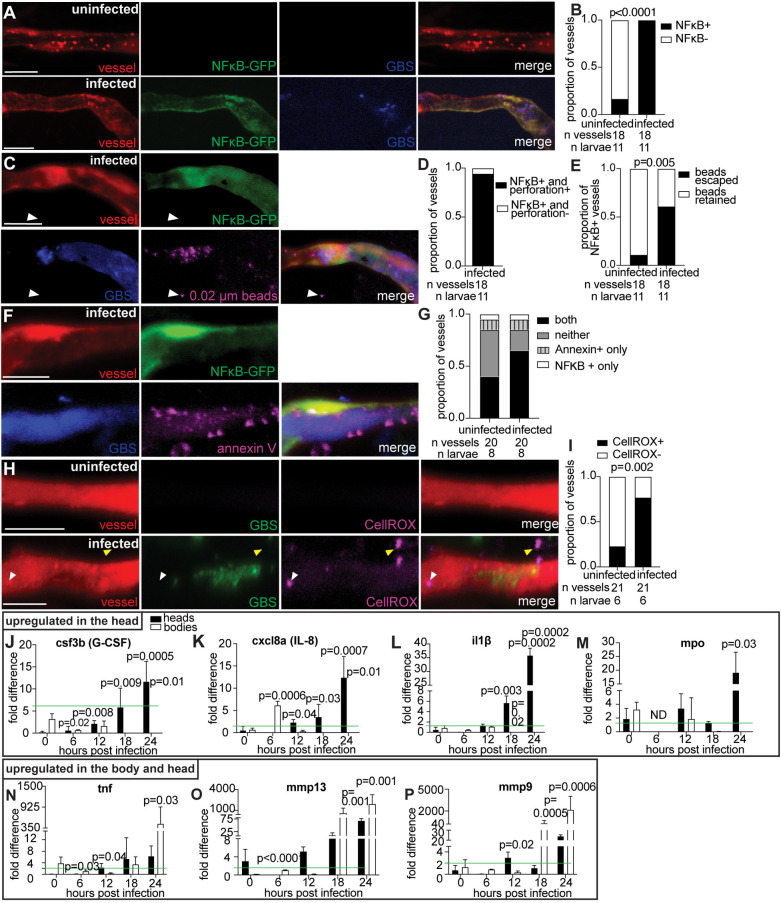
Fig 6 Upregulation of proinflammatory markers suggests host responses contribute to GBS brain invasion.

(A) Representative confocal images of uninfected (top), and infected (bottom) red fluorescent vessels from NFκB-GFP larvae at 20 hpi with approximately 100 CFU blue fluorescent GBS-eBFP. (B) Proportion of uninfected and GBS-infected vessels that are positive for NFκB; Fisher’s exact test. Representative of 2 independent experiments. (C) Representative confocal images of an infected red fluorescent vessel from a NFκB-GFP larva at 20 hpi with approximately 100 CFU blue fluorescent GBS-eBFP and intravenously injected with 0.02 µm beads (pseudocolored magenta). White arrowhead, escaped beads. (D) Proportion of GBS-infected vessels that are positive for NFκB and have vessel perforations, compared to those that lack vessel perforations. (E) Proportion of uninfected and GBS-infected vessels that are positive for NFκB and are also associated with 0.02 µm beads escaping; Fisher’s exact test. (F) Representative confocal images of an infected red fluorescent vessel from a NFκB-GFP larva at 20 hpi with approximately 100 CFU blue fluorescent GBS-eBFP and intravenously injected with annexin V (pseudocolored magenta). (G) Proportion of uninfected and GBS-infected vessels that are positive for NFκB only, positive for annexin V staining only, positive for both, or positive for neither. (H) Representative confocal images of an uninfected (top) and infected brain blood vessel (bottom) from 20 hpi larvae infected with approximately 100 CFU GBS-GFP and injected intravenously with CellROX oxidation sensor (pseudocolored magenta) just prior to imaging. White arrowhead, positive CellROX staining in vessel. Yellow arrowhead, positive CellROX staining outside the vessel endothelial cell. (I) Proportion of uninfected or GBS-infected vessels that are positive for CellROX staining; Fisher’s exact test. (J–P) qPCR mRNA abundance fold change at 0, 6, 12, 18, and 24 hpi for heads and bodies of infected larvae, compared to PBS-injected control larvae for: (J) csf3b (G-CSF) (K) cxcl8a (IL-8), (L) il1β, (M) MPO, (N) TNF, (O) MMP13, and (P) MMP9. Green line, threshold for significantly upregulated genes compared to PBS-injected larvae. ND, no data; Student t test, compared to the 0-h time point. Scale bar, 10 µm throughout. All underlying data in Fig 6 can be found in the supplemental Excel file entitled “S1 Data”.

Acknowledgments
This image is the copyrighted work of the attributed author or publisher, and ZFIN has permission only to display this image to its users. Additional permissions should be obtained from the applicable author or publisher of the image. Full text @ PLoS Biol.