IMAGE

Fig 3

ID
ZDB-IMAGE-250711-18
Source
Figures for Ravishankar et al., 2025
Image
Figure Caption

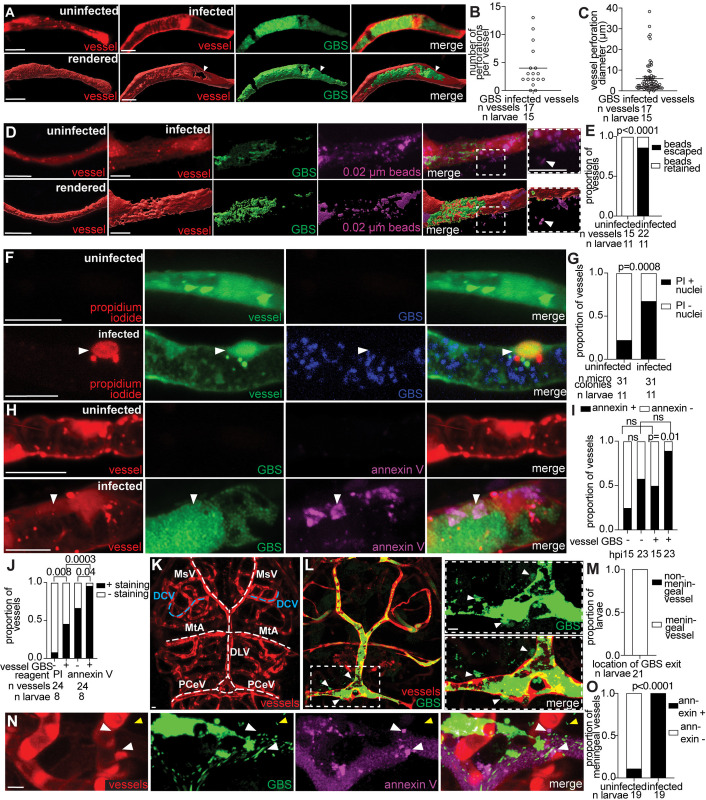
Fig 3 GBS lyses leptomeningeal endothelial cells to enter the brain.

(A) Representative confocal image (top) and 3D rendering (bottom) of an uninfected (left) and infected brain blood vessel (right), from a 20 hpi larva with red fluorescent blood vessels infected with approximately 100 CFU GBS-GFP. White arrowhead, perforation in vessel at the microcolony site. (B) Quantification of the number of perforations per GBS-infected vessel from larva in (A). Horizontal bar, mean. Representative of 3 independent experiments. (C) Maximum diameter of vessel perforations formed at GBS microcolonies from larvae in (A). Horizontal bar, mean. Representative of 3 independent experiments. (D) Representative confocal image (top) and 3D rendering (bottom) of an uninfected (left) and infected brain blood vessel (right, red fluorescent) from 20 hpi larvae infected with approximately 100 CFU GBS-GFP and injected intravenously with far red fluorescent 0.02 µm latex beads (pseudocolored magenta) just prior to imaging. Inset and white arrowhead, beads leaking from infected vessel. (E) Proportion of vessels with retained beads or beads escaped into brain, in uninfected and infected vessels in larvae in (D); Fisher’s exact test. Representative of 3 independent experiments. (F) Representative confocal images of an uninfected (top) and infected green fluorescent brain blood vessel (bottom) from a 20 hpi larva infected with approximately 100 CFU blue fluorescent wildtype GBS-eBFP and injected intravenously with red fluorescent propidium iodide (PI) just prior to imaging. White arrowhead, PI-positive endothelial cell nucleus. (G) Proportion of uninfected and GBS-infected vessels with PI-positive nuclei; Fisher’s exact test. Representative of 3 independent experiments. (H) Representative confocal images of an uninfected (top) and infected (bottom) red fluorescent brain blood vessel from 20 hpi larvae infected with approximately 100 CFU GBS-GFP and injected intravenously with annexin V-Cy5 (pseudocolored magenta). White arrowhead, positive annexin V staining in vessel endothelial cell. (I) Proportion of uninfected and GBS infected vessels with positive annexin V staining, at 15 and 23 hpi; ns: not significant, Fisher’s exact test. Representative of 4 independent experiments. (J) Proportion of uninfected and GBS infected vessels with PI-positive nuclei or positive annexin V staining; Fisher’s exact test. (K) Representative confocal image of brain blood vessels (red fluorescent). White dashed lines indicate leptomeningeal vessels: posterior cerebral vein (PCeV), dorsal longitudinal vein (DLV), mesencephalic vein (MsV), and metencephalic artery (MtA). Blue dashed line, a non-leptomeningeal control vessel, the dorsal ciliary vein (DCV). (L) Representative confocal images of approximately 100 CFU GBS-GFP exiting a red fluorescent leptomeningeal vessel. Inset and white arrowheads, GBS in the brain after exiting the vessel. (M) Proportion of larvae with GBS exiting a leptomeningeal vessel to enter the brain. (N) Representative confocal image of an infected red fluorescent brain blood vessel from a 24 hpi larva infected with approximately 100 CFU wildtype GBS-GFP and injected intravenously with annexin V (pseudocolored magenta). White arrowheads, positive annexin V staining in vessel endothelial cell where GBS is exiting the vessel. Yellow arrowheads, GBS in the brain. (O) Proportion of larvae with positive annexin V staining in leptomeningeal vessels where GBS was exiting compared to uninfected vessels; Fisher’s exact test. Scale bar, 10 µm throughout. All underlying data in Fig 3 can be found in the supplemental Excel file entitled “S1 Data”.

Acknowledgments
This image is the copyrighted work of the attributed author or publisher, and ZFIN has permission only to display this image to its users. Additional permissions should be obtained from the applicable author or publisher of the image. Full text @ PLoS Biol.