
- Title
-
Ena/VASP-EVH1 inhibition prevents chemotaxis and metastasis by blocking the EVH1-WAVE2 interaction
- Authors
- Müller, M., Barone, M., Dinther, M.V., Motzny, K., Ren, J., Eichhorst, J., Albat, D., Chiha, S., Lehmann, M., Volkmer, R., Oschkinat, H., Schmalz, H.G., Ten Dijke, P., Kühne, R.
- Source
- Full text @ Proc. Natl. Acad. Sci. USA
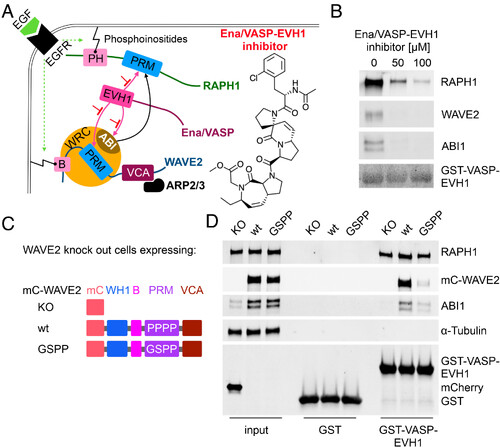
WAVE2 binds with LPPPP motif to EVH1. (A) Schematic illustration of the Ena/VASP-EVH1 interactome at the leading edge. Epidermal growth factor receptor (EGFR) signaling leads to phosphoinositides-mediated membrane association of RAPH1 via the pleckstrin-homology (PH) domain and WAVE2 via the basic (B) region. The proline-rich motif (PRM) of RAPH1, and the WAVE regulatory complex (WRC) members WAVE2, and ABI interact with the Ena/VASP-EVH1 domain and interfere with the EVH1 inhibitor. WAVE2- verprolin homology/central/acidic (VCA) domain activates the ARP2/3 complex, enabling actin polymerization and leading-edge protrusion. (B) Pull-down assays with bead-immobilized GST-VASP-EVH1 using MDA-MB-231 cell lysate and Ena/VASP-EVH1 inhibitor. The Experiment was performed in two independent replicates. (C) WAVE2 constructs: WASP homology 1 domain (WH1), basic region (B), PRM, VCA, mCherry (mC), knockout (KO). (D) Pull-down assays with bead-immobilized GST-VASP-EVH1 or GST alone as a control using cell lysates from WAVE2KO, mC-WAVE2wt, or mC-WAVE2GSPP cells. Input indicates equal expression rates for both WAVE2 constructs (panel mC-WAVE2, lanes 2 and 3) and mCherry (Lower panel, lane 1). Results were verified in two independent assays and representative results are shown. |
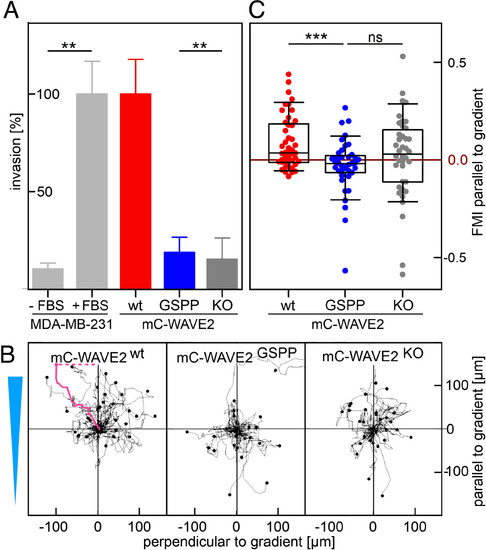
EVH1–WAVE2 interaction is needed for chemotactic response of MDA-MB-231 cells. (A) Boyden chamber invasion assay with chemoattractant-containing FBS for MDA-MB-231 cells after 16 h incubation. MDA-MB-231 cells as a control with (+FBS) and without (−FBS). Mean ± SD normalized to MDA-MB-231 +FBS. Data from two independent experiments are shown. Statistical significance (**P ≤ 0.01) was evaluated using t test analysis. (B) Trajectories from live cell tracking of MDA-MB-231 cells. FBS gradient parallel to y-axis (light blue triangle). The forward migration index parallel to the gradient was calculated by normalizing the endpoint (magenta dashed line) by the accumulated distance (magenta solid line). (C) Forward migration index (FMI) from live cell tracking of MDA-MB-231 cells parallel to the gradient of chemoattractant-containing FBS. Only mC-WAVE2wt shows a chemotactic response parallel to the FBS gradient, while mC-WAVE2KO and mC-WAVE2GSPP cells migrate randomly. Representative data from two independent experiments are shown. Statistical significance (***P ≤ 0.001, ns: not significant) was evaluated using the Mann–Whitney test. |
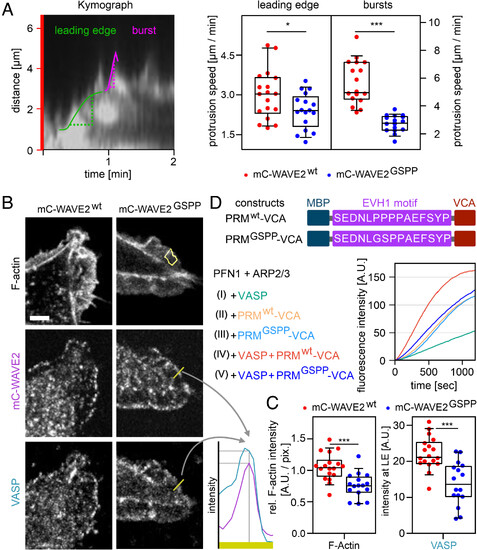
EVH1–WAVE2 interaction modulates actin polymerization rates and lamellipodial protrusion velocity. (A) Lamellipodial protrusions. Left panel: A kymograph of membrane protrusions upon stimulation with EGF after starvation in MDA-MB-231 cells with time on the x-Axis and lamellipodial protrusion along a red bar (SI Appendix, Fig. S6) from TIRF micrographs. The protrusion velocity of the leading edge (green) and fast membrane burst protrusion (pink) were calculated. Right panel: Statistical evaluation of protrusion speeds for mC-WAVE2wt and mC-WAVE2GSPP cells. Data from three independent experiments are shown. T test analysis for leading edge (*P ≤ 0.05) and Mann-Whitney test for the bursts (***P ≤ 0.001). (B) Immunofluorescence stains (confocal micrographs) for F-actin, mCherry-WAVE2 constructs, and VASP in MDA-MB-231 cells stimulated with EGF after starvation and the statistical evaluation (C). Lamellipodia were identified via F-actin stain, and signal intensity was measured (the yellow area in the Upper Right panel represents the measured region of interest). The profile of WAVE2 and VASP (yellow bar in Middle and Lower Right panels) was plotted (Lower Right panel) and the intensities for both proteins were measured at maximal WAVE2 signal, indicating the leading edge. The scale bar (white) represents 5 µm. (C) Statistical evaluation of immunofluorescence stains. The F-actin intensity in the lamellipodia (Left panel) and VASP (Right panel) in the leading edge was evaluated. Data from two independent experiments. T test analysis (***P ≤ 0.001)). (D) In vitro actin polymerization assay of pyrene-labeled G-actin in the presence of profilin (PFN1) and ARP2/3 complex. WAVE2 constructs: maltose binding protein (MBP); WAVE2 motif recognized by EVH1 (wt) and the nonbinding mutant (GSPP); VCA domain. Raw fluorescence signal over time. |
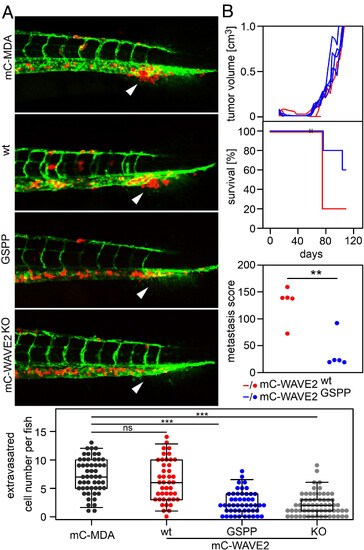
EVH1–WAVE2 interaction enables MDA-MB-231 cell extravasation and metastasis in vivo. (A) Extravasation into the avascular collagen matrix-rich tailfin of zebrafish. Upper panel: micrographs of transgenic zebrafish. Vasculature (green) and mCherry expressing MDA-MB-231 cancer cells (red). White arrows indicate the region of extravasation. Lower panel: statistical evaluation of extravasated cancer cells per fish. Data from three independent experiments, and representative results are shown. Statistical significance (ns: not significant, ***P ≤ 0.001) was evaluated using t test analysis. (B) Xenograft mouse experiment with MDA-MB-231 cells. NOG mice with orthotopically implanted mC-WAVE2wt (red) and mC-WAVE2GSPP (blue) cells. Upper panel: primary tumor volume over time. Middle panel: survival (red and blue lines) with two dropouts per group at day 53 (II). These animals were killed to ensure metastasis development. Lower panel: Metastasis score (red and blue dots). Metastasis score was determined ex vivo after the termination of each animal and represents the sum of all found metastasis in mm2 visible on the surface of the liver and lung measured with a caliper. Statistical significance (**P ≤ 0.01) was evaluated using t test analysis. |
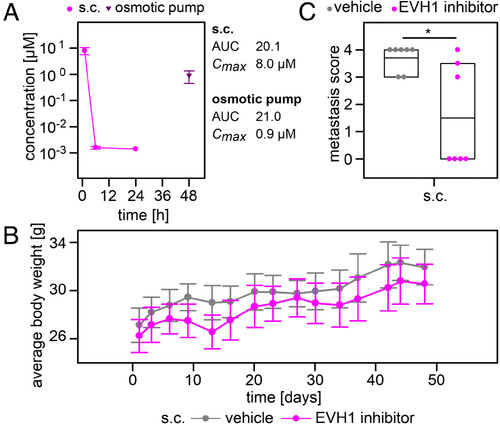
The Ena/VASP-EVH1 inhibitor reduces PANC-1 cell metastasis in vivo. (A) Mouse pharmacokinetics of the Ena/VASP-EVH1 inhibitor comparing subcutaneous (s.c) injection (dots) with the implantation of an osmotic pump (triangle). Analysis was performed in triplicates, and plasma concentrations are given as mean ± SD. Area under the curve (AUC) and maximal plasma concentration (Cmax) were calculated. (B) Average animal body weight of xenograft mouse experiment. Ena/VASP-EVH1 inhibitor (pink) and vehicle (gray) treated animals with s.c. application. (C) Metastasis scores of xenograft mouse experiment with orthotopically implanted PANC-1 cells. Animals were treated with the Ena/VASP-EVH1 inhibitor (pink) or vehicle (gray) with s.c. application. Metastasis score was determined ex vivo after the termination of all animals and represents the sum of all found metastasis in mm2 visible on the surface of the liver, lung, and spleen. Statistical significance (*P ≤ 0.05) was evaluated using the Mann–Whitney test. |