
|
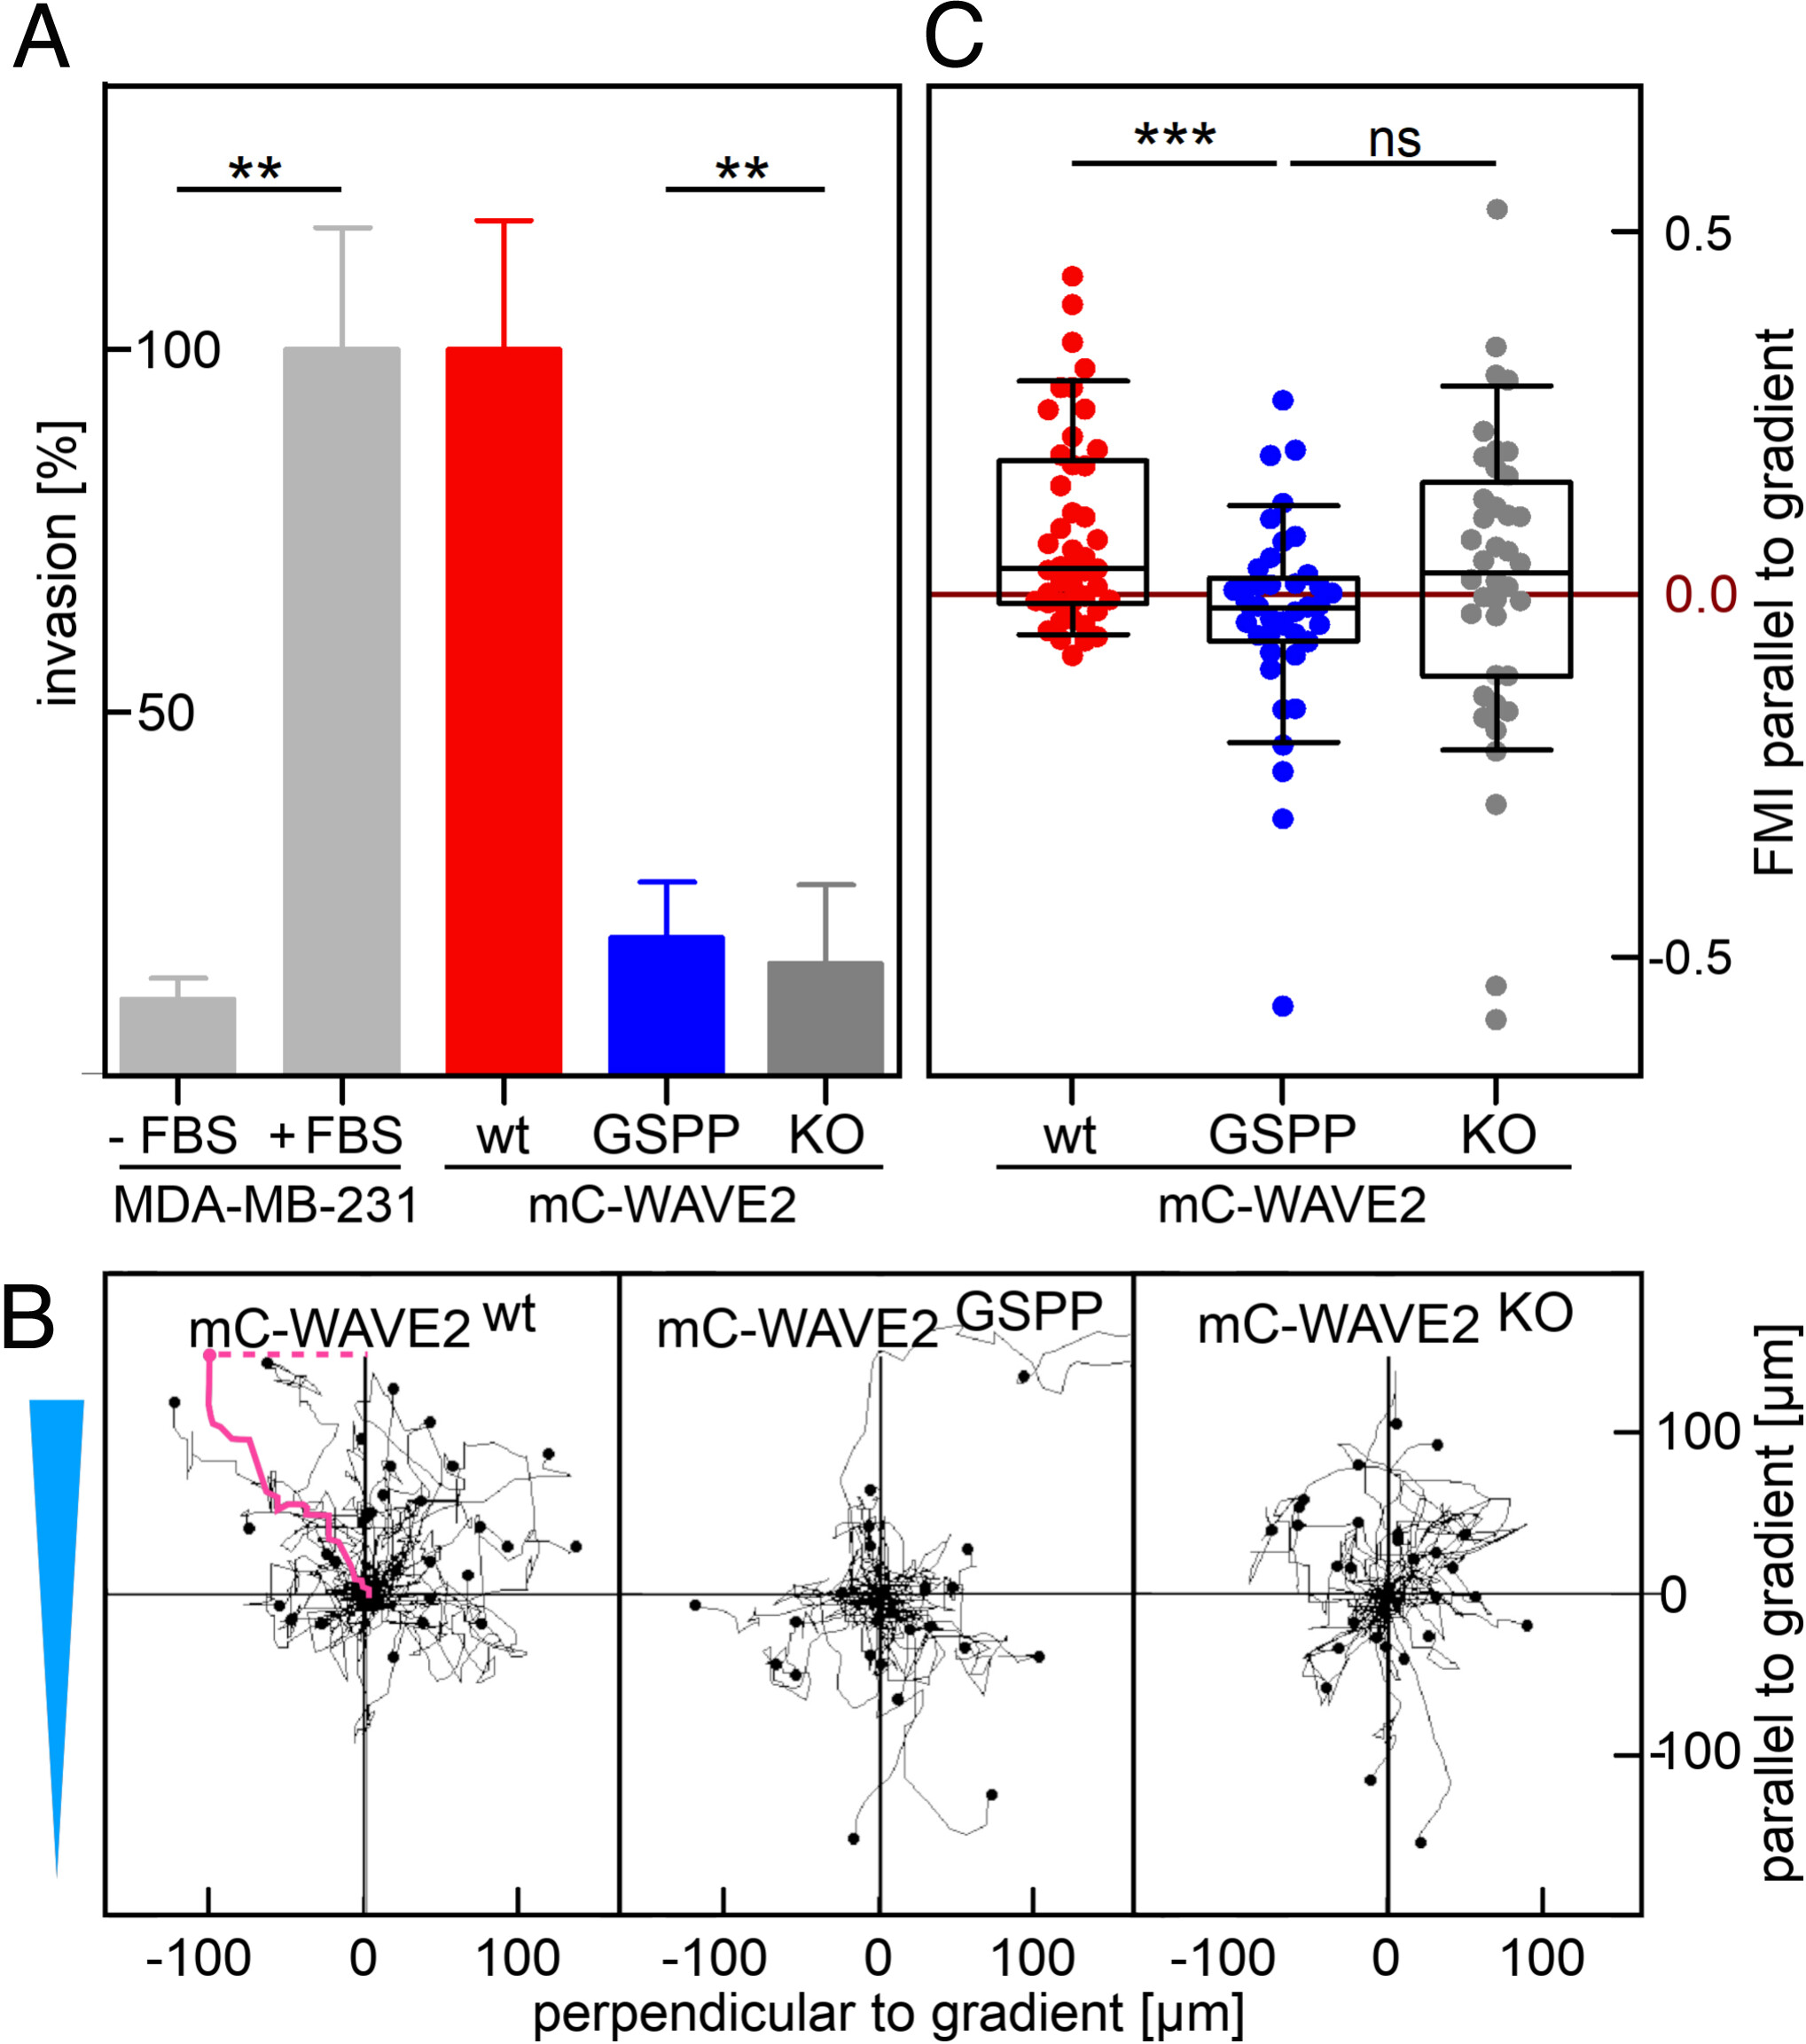
Fig. 2 EVH1–WAVE2 interaction is needed for chemotactic response of MDA-MB-231 cells. (A) Boyden chamber invasion assay with chemoattractant-containing FBS for MDA-MB-231 cells after 16 h incubation. MDA-MB-231 cells as a control with (+FBS) and without (−FBS). Mean ± SD normalized to MDA-MB-231 +FBS. Data from two independent experiments are shown. Statistical significance (**P ≤ 0.01) was evaluated using t test analysis. (B) Trajectories from live cell tracking of MDA-MB-231 cells. FBS gradient parallel to y-axis (light blue triangle). The forward migration index parallel to the gradient was calculated by normalizing the endpoint (magenta dashed line) by the accumulated distance (magenta solid line). (C) Forward migration index (FMI) from live cell tracking of MDA-MB-231 cells parallel to the gradient of chemoattractant-containing FBS. Only mC-WAVE2wt shows a chemotactic response parallel to the FBS gradient, while mC-WAVE2KO and mC-WAVE2GSPP cells migrate randomly. Representative data from two independent experiments are shown. Statistical significance (***P ≤ 0.001, ns: not significant) was evaluated using the Mann–Whitney test.