
- Title
-
The snakehead retrovirus promoter functions independently of the 3'ORF protein and its products are maternally inherited in transgenic zebrafish
- Authors
- Zamostiano, R., Pisanty, O., Kembou-Ringert, J.E., Abu Rass, R., Eldar, A., Ehrlich, M., Gothilf, Y., Bacharach, E.
- Source
- Full text @ PLoS Pathog.
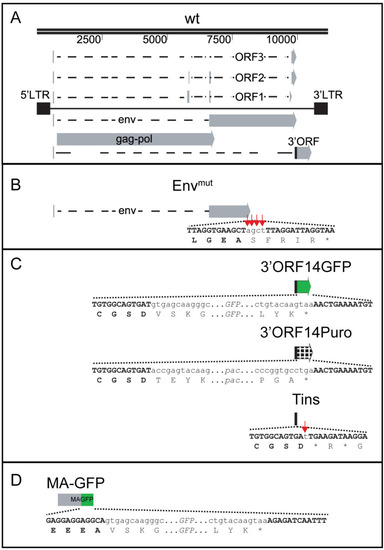
Schematics of the wt and mutants SnRV clones. (A) Scaled schematics of SnRV wt clone, based on [ |
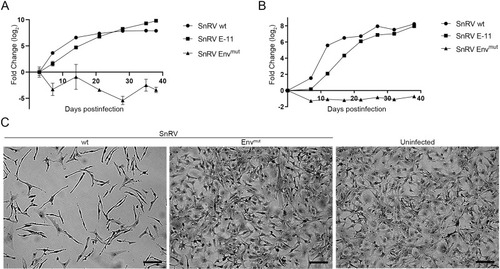
SnRV wt molecular clone is infectious. (A, B) Kinetics of SnRV spread. BF-2 cells were infected with equal amounts - normalized by qRT-PCR with SnRV |
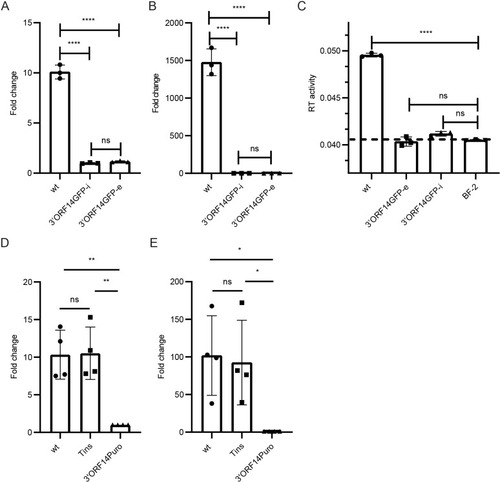
Effects of 3’ORF replacements on the levels of SnRV genomic RNA and virions. Genomic RNA levels (quantification by qRT-PCR with |
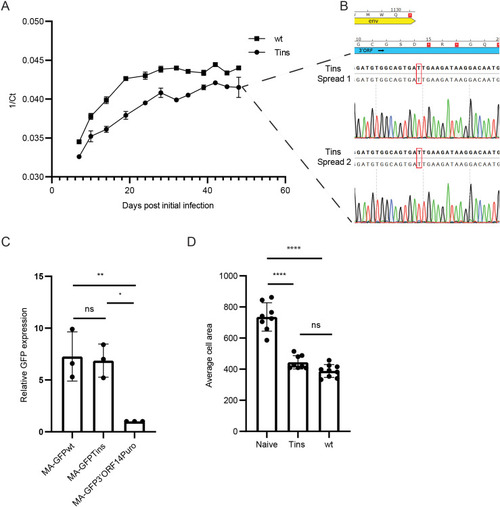
Spreading, expression, and induction of an elongated phenotype of wt and Tins clones in BF-2 cells. (A) Spreading of wt and Tins clones in BF-2 cultures. The levels of the viral genomic RNA in the culture supernatants were quantified by qRT-PCR and are presented as the average, with standard error bars, of the 1/Ct values of two samples per each time point from two independent spreading assays. (B) Sequence chromatograms from the two independent spreading assays (Spread 1 and 2) of the Tins clone. Supernatants of Tins-infected cultures from (A) were collected 48 days after the initial infection. The region containing the overlap between the env (yellow) and 3’ORF (blue) genes and the T insertion was amplified by RT-PCR and sequenced. Bold and regular letters represent the expected and the actual sequences, respectively. Red rectangles mark the inserted T. Red squares with white asterisks represent stop codons. Amino acids appear in a 1-letter code. (C) MA-GFP expression of SnRV MA-GFPwt, MA-GFPTins, or MA-GFP3’ORF14Puro clones. Equal amounts of the indicated clones were electroporated into BF-2 cells together with a mCherry-expressing plasmid (transfection efficiency control). Three days posttransfection, the transfected cultures were analyzed using flow cytometry for GFP and mCherry signals. The graph depicts the GFP expression levels (normalized to mCherry expression) of the indicated clones relative to the MA-GFP3’ORF14Puro clone (which was set to 1); n = 3. (D) Naïve, or wt or Tins -infected BF-2 cells were stained and imaged, and their average cell area was calculated. 300-500 cells were monitored for each kind of cell. * p ≤ 0.05, ** p ≤ 0.01, **** p ≤ 0.0001; one-way ANOVA. |
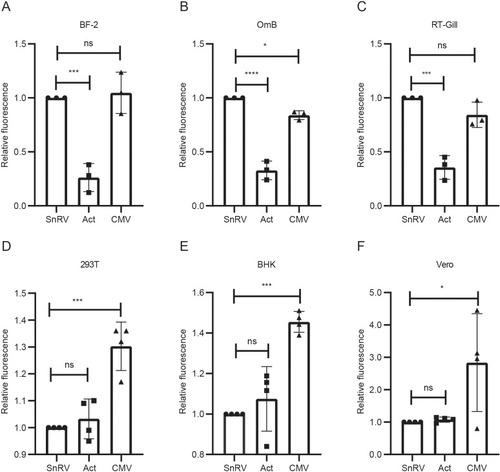
SnRV promoter activity in fish and mammalian cells. The indicated fish (A-C) or mammalian (D-F) cells were transfected with the GFP reporter gene under the control of the SnRV promoter (SnRV, circles), the tilapia β-actin promoter (Act, squares), or CMV promoter (CMV, rectangles). The Y-axes present the GFP mean fluorescence relative to the SnRV promoter sample (which was set to 1), quantified by FACS one day posttransfection, except for the RTgill-W1 cells (C) that were analyzed two days posttransfection. n = 3 or 4 for fish or mammalian cells, respectively. *p ≤ 0.05, ***p ≤ 0.001, ****p ≤ 0.0001, ns - not significant; one-way ANOVA. |
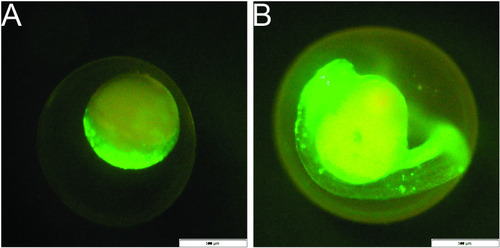
Transient expression of SnRV promoter in zebrafish embryos. The SnRV LTR-GFP plasmid was injected into zebrafish zygotes and monitored at one-hour intervals. Expression began at the blastula stage (A) and was continually evident throughout development and organogenesis (B). Bars = 500 µM. |
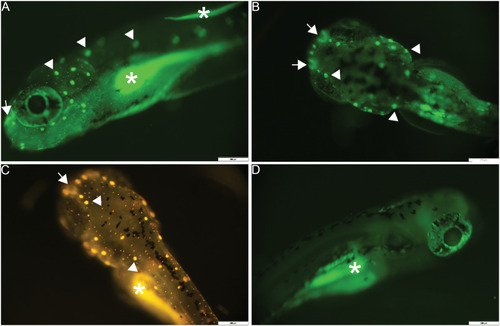
Expression of SnRV promoter in sensory organs of transgenic zebrafish larvae. Lateral (A, D) and dorsal (B, C) views of a 6 dpf |
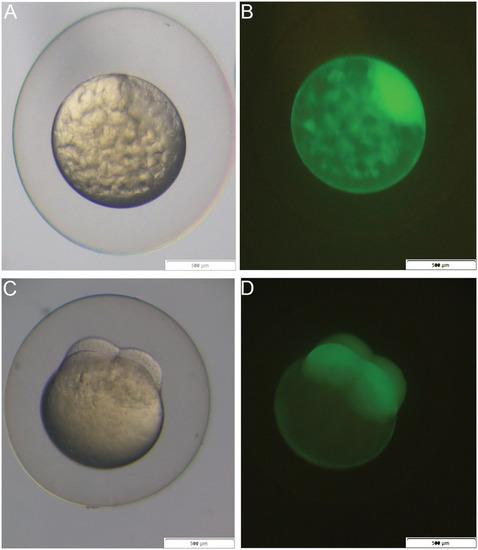
Maternal inheritance of the GFP reporter. Brightfield (A, C) and fluorescent images (B, D) of a fertilized zebrafish egg (A, B) and a four-cell stage embryo (C, D) derived from the transgenic female. Images depict the accumulation of GFP at the animal pole (B), and the blastomeres (D). Bars = 500 µM. |
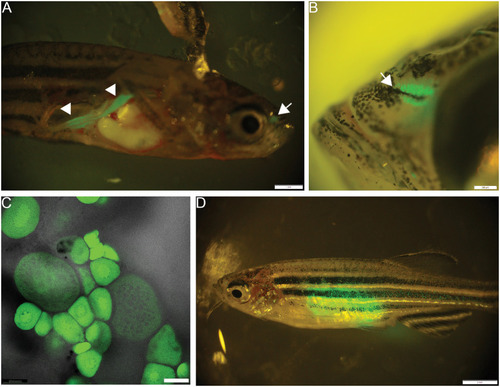
Expression of SnRV promoter in the adult olfactory epithelium and gonads. Lateral views of dissected (A) and undissected (B) transgenic males, showing GFP signal in the testis (A; arrowheads) and the olfactory epithelium (A, B; arrows). (C) An isolated ovarian biopsy showing a GFP signal in oocytes of different developmental stages. (D) A lateral view of an undissected adult transgenic female showing the ovarian-generated GFP signal. |