
|
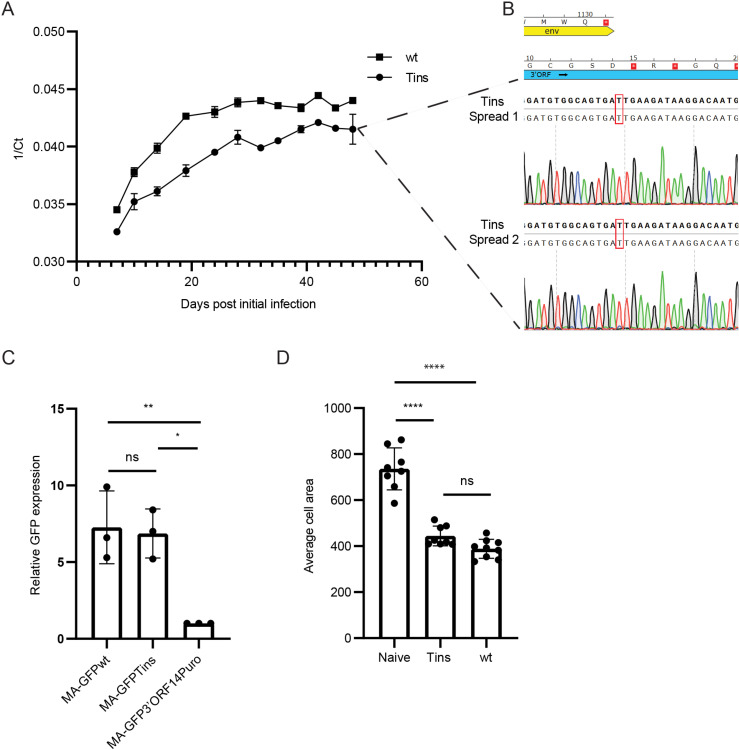
Fig 4 Spreading, expression, and induction of an elongated phenotype of wt and Tins clones in BF-2 cells.
(A) Spreading of wt and Tins clones in BF-2 cultures. The levels of the viral genomic RNA in the culture supernatants were quantified by qRT-PCR and are presented as the average, with standard error bars, of the 1/Ct values of two samples per each time point from two independent spreading assays. (B) Sequence chromatograms from the two independent spreading assays (Spread 1 and 2) of the Tins clone. Supernatants of Tins-infected cultures from (A) were collected 48 days after the initial infection. The region containing the overlap between the env (yellow) and 3’ORF (blue) genes and the T insertion was amplified by RT-PCR and sequenced. Bold and regular letters represent the expected and the actual sequences, respectively. Red rectangles mark the inserted T. Red squares with white asterisks represent stop codons. Amino acids appear in a 1-letter code. (C) MA-GFP expression of SnRV MA-GFPwt, MA-GFPTins, or MA-GFP3’ORF14Puro clones. Equal amounts of the indicated clones were electroporated into BF-2 cells together with a mCherry-expressing plasmid (transfection efficiency control). Three days posttransfection, the transfected cultures were analyzed using flow cytometry for GFP and mCherry signals. The graph depicts the GFP expression levels (normalized to mCherry expression) of the indicated clones relative to the MA-GFP3’ORF14Puro clone (which was set to 1); n = 3. (D) Naïve, or wt or Tins -infected BF-2 cells were stained and imaged, and their average cell area was calculated. 300-500 cells were monitored for each kind of cell. * p ≤ 0.05, ** p ≤ 0.01, **** p ≤ 0.0001; one-way ANOVA.