
|
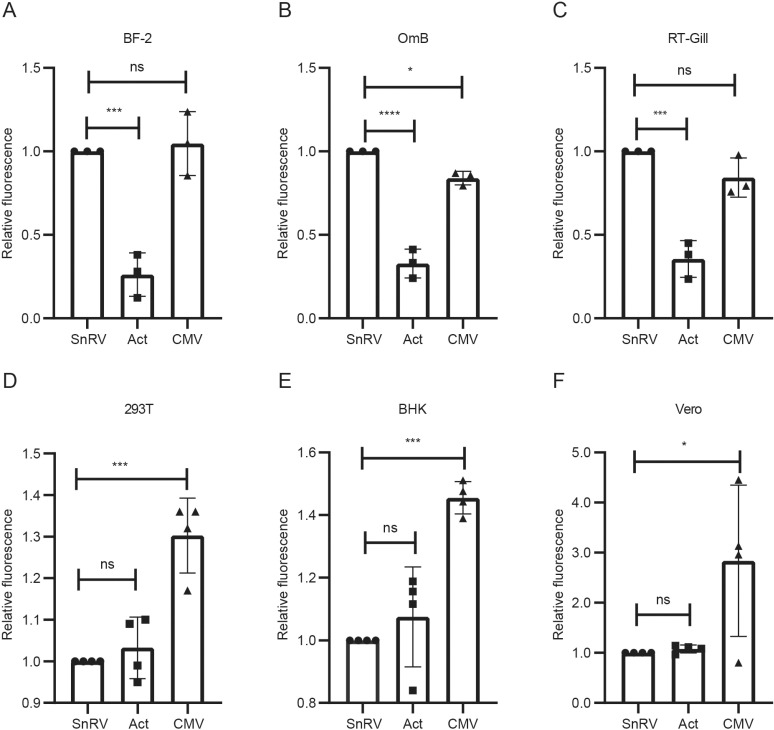
Fig 5 SnRV promoter activity in fish and mammalian cells.
The indicated fish (A-C) or mammalian (D-F) cells were transfected with the GFP reporter gene under the control of the SnRV promoter (SnRV, circles), the tilapia β-actin promoter (Act, squares), or CMV promoter (CMV, rectangles). The Y-axes present the GFP mean fluorescence relative to the SnRV promoter sample (which was set to 1), quantified by FACS one day posttransfection, except for the RTgill-W1 cells (C) that were analyzed two days posttransfection. n = 3 or 4 for fish or mammalian cells, respectively. *p ≤ 0.05, ***p ≤ 0.001, ****p ≤ 0.0001, ns - not significant; one-way ANOVA.