|
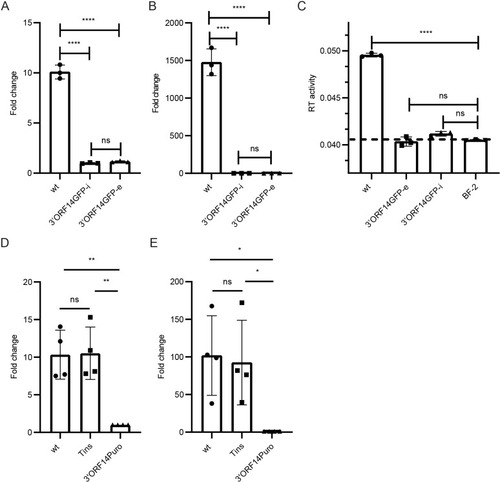
Effects of 3’ORF replacements on the levels of SnRV genomic RNA and virions. Genomic RNA levels (quantification by qRT-PCR with pol-derived primers) in cell extracts (normalized to actin RNA levels, A) or culture supernatant (140µl, B) of BF-2 cultures chronically infected with the wt virus (wt) or the 3’ORF14GFP clone (3’ORF14GFP-i), or stably transfected with the 3’ORF14GFP clone (3’ORF14GFP-e). (A, B) The graphs show the fold change in the SnRV genomic RNA levels in wt and 3’ORF14GFP-e relative to the 3’ORF14GFP-i (set to 1) cultures. Each bar represents the average of three technical repeats. ****p ≤ 0.0001, ns - not significant; one-way ANOVA. (C) SG-PERT assay for SnRV RT activity. The supernatants of the indicated cultures (10 ml each) were subjected to ultracentrifugation, and the RT activity of the pellets was determined as in Fig 2B. The dashed line marks the background level obtained from supernatant pellets of naïve BF-2 cultures (BF-2). Each bar represents the average of three technical repeats. (D, E) SnRV clones (wt, Tins, or 3’ORF14Puro) were electroporated into BF-2 cells, and three days posttransfection, the SnRV genomic RNA levels were quantified in cell extracts (D) and culture supernatants (E), by qRT-PCR and normalized to the transfection efficiencies. Transfection efficiencies were quantified by measuring the leaky transcription (in the fish cells) of the yeast LEU2 gene, located in the pGREG525 plasmid backbone shared by the different SnRV constructs. Graphs show the fold change in the normalized genomic RNA of wt and Tins clones, relative to 3’ORF14Puro clone (set to 1); n = 4, * p ≤ 0.05, ** p ≤ 0.01, ns - not significant; one-way ANOVA.
|