
- Title
-
Lanthanum oxide nanoparticles induce AHR-mediated hepatotoxicity in zebrafish via oxidative stress and metabolic dysregulation
- Authors
- Wang, J.X., Liu, Y., Ding, Y., Zhang, B.F., Liao, Y.L., Zuo, S.J., Zhou, Q.H., Li, Y., Pei, D.S.
- Source
- Full text @ Ecotoxicol. Environ. Saf.
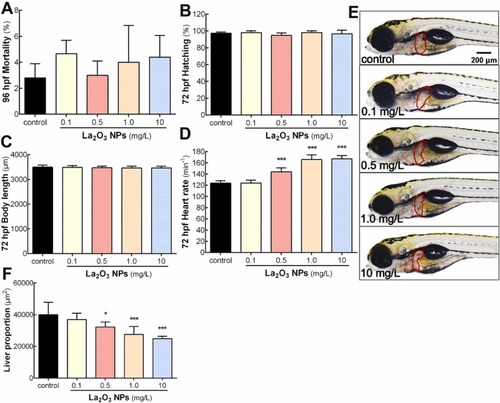
Developmental toxicity of La2O3 NPs to zebrafish embryos and larvae. (A) Mortality of zebrafish larvae exposed to La2O3 NPs at 96 hpf. (B) Hatchability of zebrafish larvae exposed to La2O3 NPs at 72 hpf. (C) The body length of zebrafish larvae exposed to La2O3 NPs at 72 hpf. (D) Heart rate of zebrafish larvae exposed to La2O3 NPs at 72 hpf. (E) Liver morphology and size of zebrafish larvae exposed to La2O3 NPs at 120 hpf. (F) Liver area statistics of zebrafish larvae exposed to La2O3 NPs at 120 hpf. Values are expressed as mean ± SEM. Statistical analysis was done by One-way ANOVA and Bonferroni test, compared to the control group, *p < 0.05, * * p < 0.01, * ** p < 0.001. |
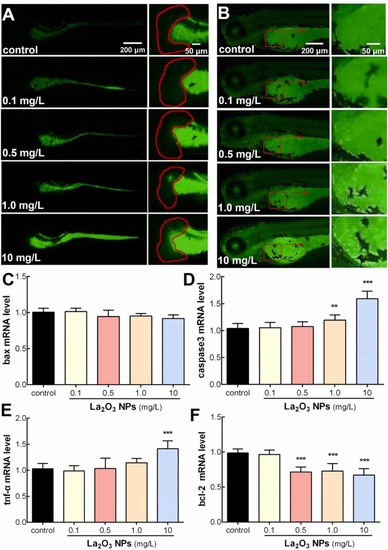
La2O3 NPs induced oxidative stress and apoptosis in zebrafish larvae. (A) Reactive oxygen species (ROS) content in zebrafish larvae after treatment by La2O3 NPs at 120 hpf. (B) AO staining of zebrafish larvae exposed to 72 hpf. The mRNA expression of (C) bax, (D) caspase3, (E) tnf-a, (F) bcl-2 after zebrafish larvae were exposed to La2O3 NPs. Values are expressed as mean ± SEM. Statistical analysis was done by One-way ANOVA and Bonferroni test, compared to the control group, *p < 0.05, * *p < 0.01, * **p < 0.001. |
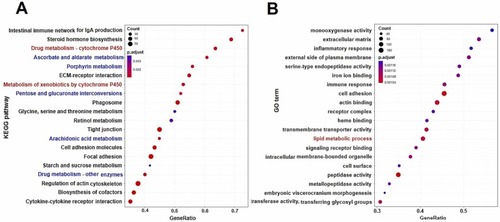
Exploring potential molecular mechanisms through RNA-Seq and bioinformatics analysis. (A) KEGG enrichment analysis. (B) GO enrichment analysis. |
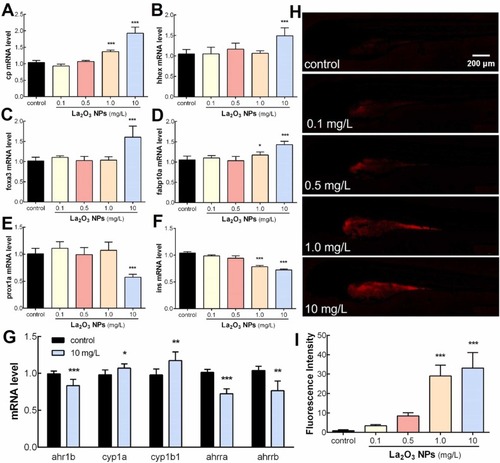
La2O3 NPs induced the change of liver development gene expression and the activation of the ahr signaling pathway in zebrafish. The mRNA expression of (A) cp, (B) hhex, (C) foxa3, (D) fabp10a, (E) prox1a, (F) ins after zebrafish larvae were exposed to La2O3 NPs. (G) ahr signaling pathway in zebrafish larvae exposed to La2O3 NPs. (H-I) Fluorescence intensity of cyp1a-mcherry zebrafish larvae exposed to La2O3 NPs to 120 hpf. Values are expressed as mean ± SEM. Statistical analysis was done by One-way ANOVA and Bonferroni test, compared to the control group, *p < 0.05, * *p < 0.01, * **p < 0.001. |
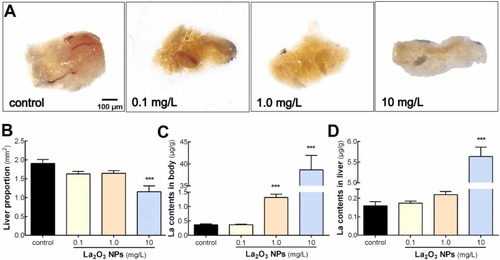
Liver morphology and La content of zebrafish after exposure to La2O3 NPs. (A) Liver morphology, (B) Liver area after 90 days of La2O3 NPs exposure. (C) Content of La in zebrafish after continuous exposure to La2O3 NPs for 90 days. (D) La content in the liver of zebrafish after 90 days of continuous exposure to La2O3 NPs. Values are expressed as mean ± SEM. Statistical analysis was done by One-way ANOVA and Bonferroni test, compared to the control group, *p < 0.05, * *p < 0.01, * **p < 0.001. |
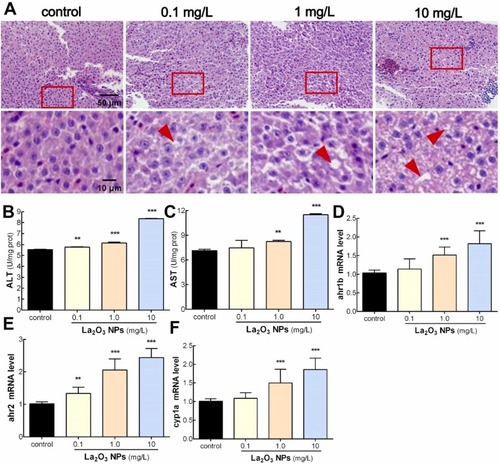
Exposure to La2O3 NPs induced liver injury in zebrafish. (A) Histological lesions in the liver exposed to La2O3 NPs. Macro vacuoles were indicated by red arrows. (B) ALT, (C) AST activity in the liver of zebrafish in the control group and La2O3 NPs exposure group. (D-F) The mRNA expression of ahr1b, ahr2, and cyp1a genes in the liver. Values are expressed as mean ± SEM. Statistical analysis was done by One-way ANOVA and Bonferroni test, compared to the control group, *p < 0.05, * *p < 0.01, * **p < 0.001. |
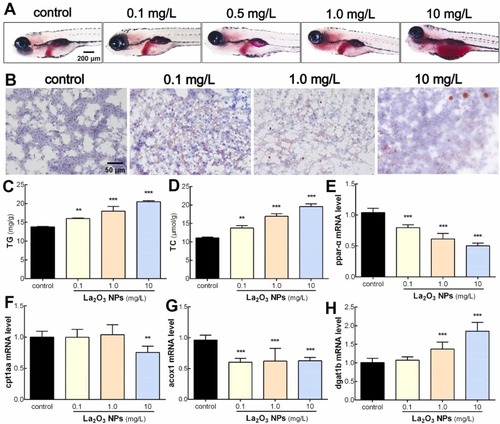
Effects of La2O3 NPs exposure on lipid metabolism. (A) The Oil red O lipid staining of zebrafish larvae. (B) The Oil red O lipid staining of the liver of adult zebrafish in each group. (C) TG, (D) TC content in the liver of zebrafish in each group. The mRNA expression of (E) ppar-α, (F) cpt1aa, (G) acox1, (H) dgat1b in the liver. Values are expressed as mean ± SEM. Statistical analysis was done by One-way ANOVA and Bonferroni test, compared to the control group, *p < 0.05, * *p < 0.01, * **p < 0.001. |
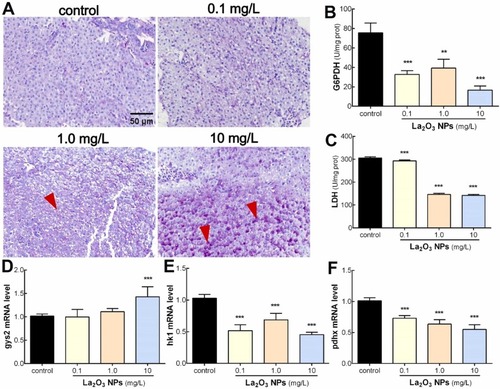
Effects of La2O3 NPs exposure on glucose metabolism. (A) PAS staining of the liver. Glycogen deposits were indicated by red arrows. (B) G6PDH, (C) LDH activity in the liver of zebrafish in the control group and La2O3 NPs exposure group. The mRNA expression of (D) gys2, (E) hk1, and (F) pdhx after zebrafish were exposed to La2O3 NPs. Values are expressed as mean ± SEM. Statistical analysis was done by One-way ANOVA and Bonferroni test, compared to the control group, *p < 0.05, * *p < 0.01, * **p < 0.001. |