
|
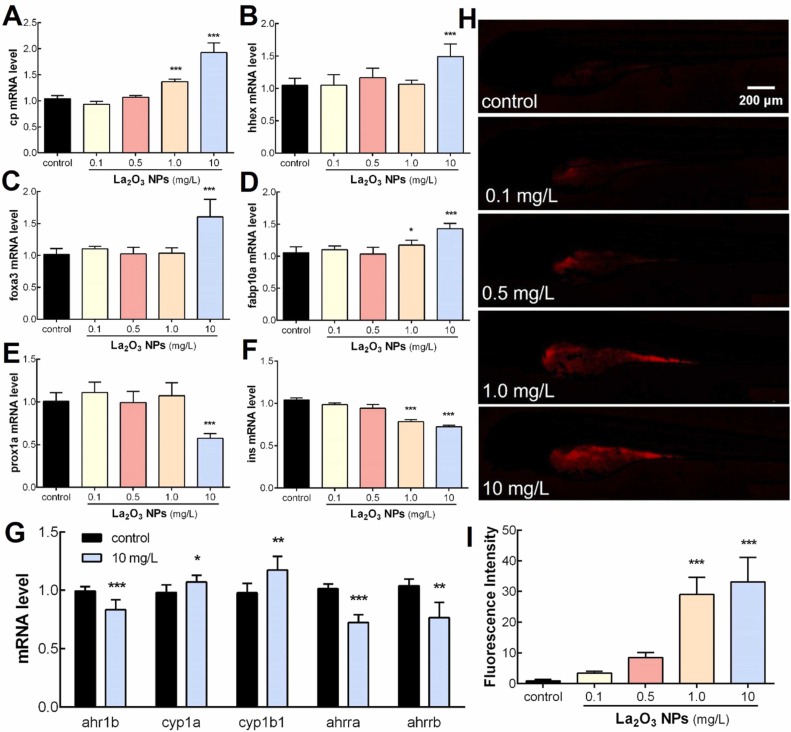
Fig. 4 La2O3 NPs induced the change of liver development gene expression and the activation of the ahr signaling pathway in zebrafish. The mRNA expression of (A) cp, (B) hhex, (C) foxa3, (D) fabp10a, (E) prox1a, (F) ins after zebrafish larvae were exposed to La2O3 NPs. (G) ahr signaling pathway in zebrafish larvae exposed to La2O3 NPs. (H-I) Fluorescence intensity of cyp1a-mcherry zebrafish larvae exposed to La2O3 NPs to 120 hpf. Values are expressed as mean ± SEM. Statistical analysis was done by One-way ANOVA and Bonferroni test, compared to the control group, *p < 0.05, * *p < 0.01, * **p < 0.001.