
Image
|
Figure Caption
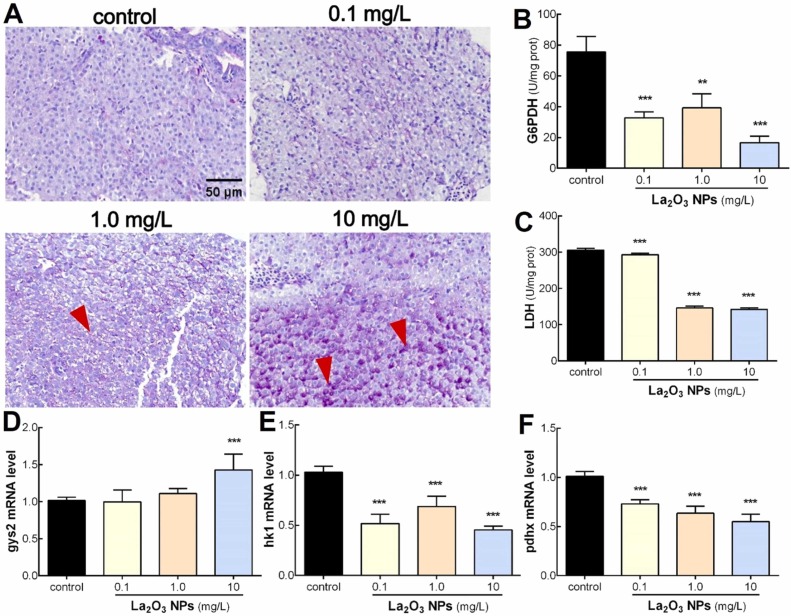
Fig. 8 Effects of La2O3 NPs exposure on glucose metabolism. (A) PAS staining of the liver. Glycogen deposits were indicated by red arrows. (B) G6PDH, (C) LDH activity in the liver of zebrafish in the control group and La2O3 NPs exposure group. The mRNA expression of (D) gys2, (E) hk1, and (F) pdhx after zebrafish were exposed to La2O3 NPs. Values are expressed as mean ± SEM. Statistical analysis was done by One-way ANOVA and Bonferroni test, compared to the control group, *p < 0.05, * *p < 0.01, * **p < 0.001.
Acknowledgments
This image is the copyrighted work of the attributed author or publisher, and
ZFIN has permission only to display this image to its users.
Additional permissions should be obtained from the applicable author or publisher of the image.
Full text @ Ecotoxicol. Environ. Saf.