
- Title
-
Mgat4b-mediated selective N-glycosylation regulates melanocyte development and melanoma progression
- Authors
- Sharma, B., Aswin, K., Jain, T., Nasreen, A., Aggarwal, A., Subramaniam, Y.J., Rengaraju, J., Agrawal, S.J., Bhatt, M., Paul, B., Chandrasekaran, K., Yadav, A., Soni, J., Ujjainiya, R., Akhter, M.Q., Pandey, R., Suresh, S., Sampathkumar, S.G., Natarajan, V.T.
- Source
- Full text @ Proc. Natl. Acad. Sci. USA
|
Melanocyte specific ablation of |
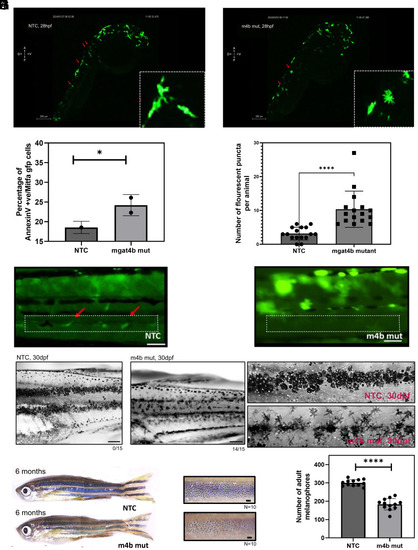
Melanocyte specific ablation of |
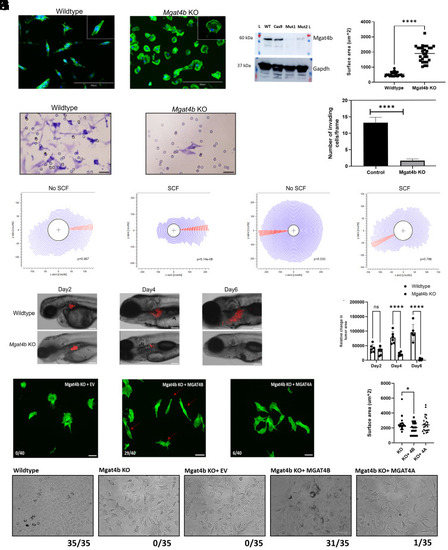
Loss of |
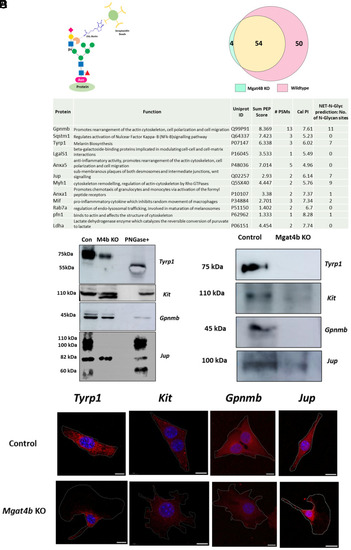
Differential proteomics reveal melanocyte specific target proteins of MGAT4B. ( |
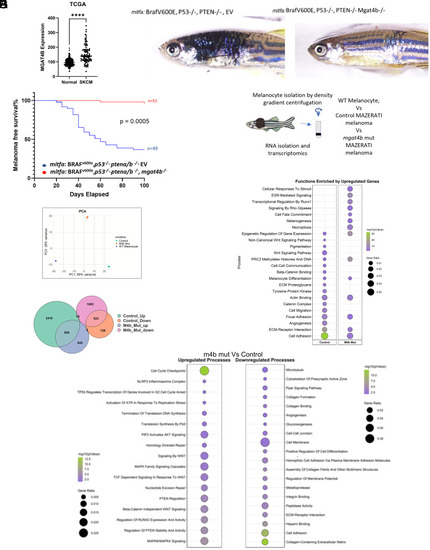
Elevated MGAT4B levels correlate with poor patient survival and are crucial for initiating primary tumors. ( |