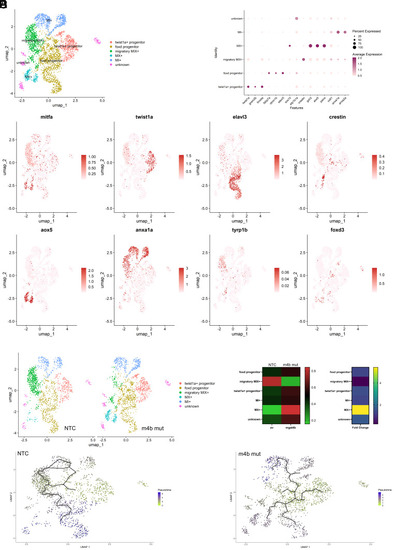
Melanocyte specific ablation of mgat4b leads to cell-arrest and results in cell death. (A) UMAP visualization of the zebrafish mitfa+ve cells integrated from nontargeted control (NTC) and melanocyte specific knock out of mgat4b (m4b mut)cells colored by the identified states. (B) Dot plot showing the top marker genes enriched in each cluster with the size showing the percent of cell expressing the gene and color showing the scaled mean expression value in each cluster. (C) UMAPs of mitfa+ cells with color change from light pink (negative) to red based on log normalized scaled expression of mitfa, twist1a, elavl3, crestin, aox5, anxa1a and tyrp1b and foxd3. (D) UMAP visualization of the Zebrafish mitfa+ve cells from NTC and mgat4b mut cells colored by the identified states E (Left panel). Heat map showing the proportion of cells belonging to certain cell-type distributed between NTC and mgat4b mut samples E (Right panel). Heat map depicting fold change of the cell number across NTC and mgat4b mutant sample. (F) Pseudotime ordering of the cells in NTC (Left) and mgat4b mutant (Right), coloring based on pseudotime scores (Wilcoxon–Mann–Whitney test with average log fold change > 1 and adjusted P value ≤ 0.05).
|
