FIGURE SUMMARY
Title

Activity-driven myelin sheath growth is mediated by mGluR5

Authors
Braaker, P.N., Mi, X., Soong, D., Bin, J.M., Marshall-Phelps, K., Bradley, S., Benito-Kwiecinski, S., Meng, J., Arafa, D., Richmond, C., Keatinge, M., Yu, G., Almeida, R.G., Lyons, D.A.
Source
Full text @ Nat. Neurosci.

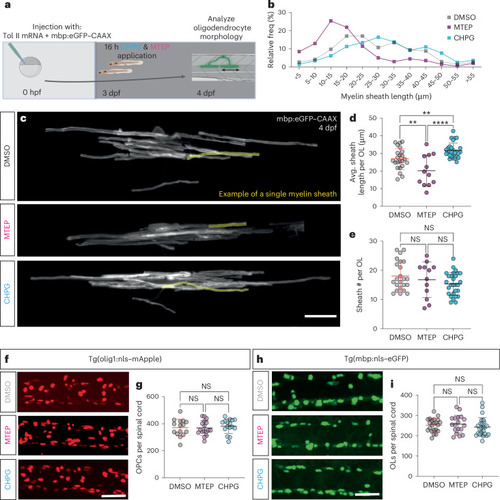
mGluR5 stimulation increases myelin sheath length without affecting cell number.

a, Protocol to label individual oligodendrocytes, manipulate mGluR5 activity and assess myelination. b, Relative frequency of sheath lengths (DMSO n = 427, mean 16.79 µm; MTEP n = 201, mean 18.41 µm; CHPG n = 470, mean 30.44 µm). c, Individual oligodendrocytes at 4 dpf, labeled with mbp:eGFP–CAAX, after treatment with DMSO, mGluR5 antagonist MTEP and allosteric agonist CHPG. Scale bar, 15 µm. d, Mean sheath length per oligodendrocyte (one OL/fish) post treatment (one-way analysis of variance (ANOVA), P < 0.0001; Holm–Šídák’s multiple comparisons test: DMSO versus CHPG P = 0.0062, DMSO versus MTEP P = 0.0047; CHPG versus MTEP P < 0.0001). 1% DMSO (N = 23, 26.90 µm ± 6.031), CHPG (N = 28, 31.66 µm ± 4.27) and MTEP (N = 12, 20.15 µm ± 8.77). e, Number of myelin sheaths produced by single oligodendrocytes (one-way ANOVA; P = 0.2090, Kruskal–Wallis DMSO versus CHPG P = 0.2477; DMSO versus MTEP P > 0.9999; CHPG versus MTEP P > 0.9999). DMSO, N = 23, 18.04 ± 4.995; MTEP, N = 12, 16.75 ± 3.89; CHPG N = 28, 15.32 ± 6.08). Scale bar, 50 µm. f, Representative images of Tg(olig1:nls–mApple) after pharmacological manipulation of mGluR5. Scale bar, 50 µm. g, Number OPCs in the spinal cord (one-way ANOVA; P = 0.7774; Tukey’s multiple comparisons test, DMSO versus MTEP P = 0.9908; DMSO versus CHPG P = 0.8579; CHPG versus MTEP P = 0.7781), DMSO (N = 15); CHPG (N = 17); MTEP (N = 16). DMSO 371.1 ± 62.39; MTEP 368.5 ± 54.37; CHPG 381.8 ± 53.13. h, Representative images of Tg(mbp:nls–eGFP) after pharmacological manipulation of mGluR5. i, Number of myelinating oligodendrocytes in the spinal cord (one-way ANOVA; P = 0.5155; Tukey’s multiple comparisons test: DMSO versus MTEP P = 0.9141; DMSO versus CHPG P = 0.7359; CHPG versus MTEP P = 0.5037), DMSO (N = 22); CHPG (N = 25); MTEP (N = 18). DMSO, 252 ± 33.24; MTEP, 257.3 ± 43.61; CHPG, 243 ± 45.46. Scale bar, 50 µm. Data indicate mean ± s.d.

Source data

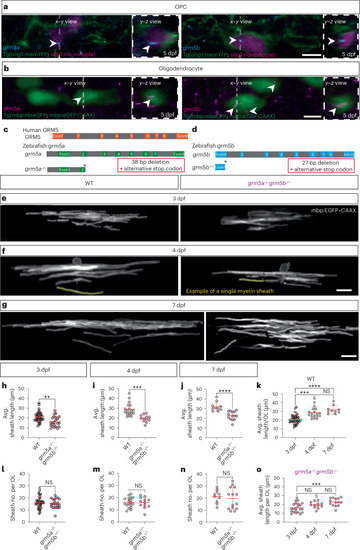
Mutations in genes encoding mGluR5 reduce myelin sheath length without affecting sheath number.

a, HCR detection of grm5a and grm5b messenger RNA in OPCs at 5 dpf. Scale bar, 5 μm. b: HCR detection of grm5a and grm5b mRNA in OLs at 5 dpf. Scale bar, 5 μm. c,d, Schematic showing organization of human and zebrafish genes encoding mGluR5 and their CRISPR/Cas9 based editing that led to identification of mutants with premature STOP codons in exons 2 and 1 of grm5a (c) and grm5b (d), respectively. e, Images of wild-type (N = 35) and grm5a−/−grm5b−/− (N = 22) oligodendrocytes expressing mbp:eGFP–CAAX. f, Images of wild-type (N = 18) and grm5a−/−grm5b−/− (N = 12) oligodendrocytes expressing mbp:eGFP–CAAX at 4 dpf. g, Images of wild-type (N = 10) and grm5a−/−grm5b−/− (N = 14) oligodendrocytes expressing mbp:eGFP–CAAX at 7 dpf. Scale bars 15 μm (eg). h, Mean sheath length of wild-type (N = 35, 21.11 ± 5.149) and grm5a−/−grm5b−/− (N = 22, 16.34 ± 5.38) oligodendrocytes, in 3 dpf old animals (two-sided Mann–Whitney U-test, P = 0.0035). i, Mean sheath length of wild-type (N = 18, 28.8 ± 6.5) and grm5a−/−grm5b−/− (N = 12, 19.47 ± 3.67) oligodendrocytes, in 4 dpf old animals (two-sided unpaired t-test: P = 0.0001). j, Mean sheath length of wild-type (N = 10, 31.79 ± 4.723) and grm5a−/−grm5b−/− (N = 14, 22.68 ± 4.40) oligodendrocytes, in 7 dpf old animals (two-sided unpaired t-test: P < 0.0001). k, Comparison of mean sheath length in wild-type animals between 3, 4 and 7 dpf animals (one-way ANOVA, Kruskal–Wallis test P < 0.0001; Dunn’s multiple comparisons test: wild-type 3 dpf versus 4 dpf P = 0.0002; wild-type 4 dpf to 7 dpf P = 0.7173, wild-type 3 dpf versus 7 dpf P < 0.0001). (3 dpf, 21.11 ± 5.149; 4 dpf, 28.8 ± 6.52; 7 dpf, 31.79 ± 4.72). l, Number of myelin sheath per oligodendrocyte in 3 dpf wild-type (16.2 ± 4.8) and grm5a−/−grm5b−/− (15.36 ± 3.94) (two-sided unpaired t-test; P = 0.4964). m, Number of sheaths per oligodendrocyte in 4 dpf wild-type (16.06 ± 4.03) and grm5a−/−grm5b−/− (15.92 ± 34.46) (two-sided unpaired t-test; P = 0.9301). n, Number of myelin sheath per oligodendrocyte in 7 dpf wild-type (21.2 ± 5.35) and grm5a−/−grm5b−/− (19.5 ± 8.91) (two-sided unpaired t-test; P = 0.5971). o, Comparison of the mean sheath length in grm5a−/−grm5b−/− animals between 3, 4 and 7 dpf animals (one-way ANOVA, Kruskal–Wallis test P < 0.0001; Dunn’s multiple comparisons test: grm5a−/−grm5b−/− 3 dpf versus 4 dpf P = 0.1675; grm5a−/−grm5b−/− 4 dpf to 7 dpf P = 0.2070, grm5a−/−grm5b−/− 3 dpf versus 7 dpf P < 0.0009) (3 dpf, 16.34 ± 5.38; 4 dpf, 19.47 ± 3.67; 7 dpf, 22.68 ± 4.40). Data show mean ± s.d.

Source data

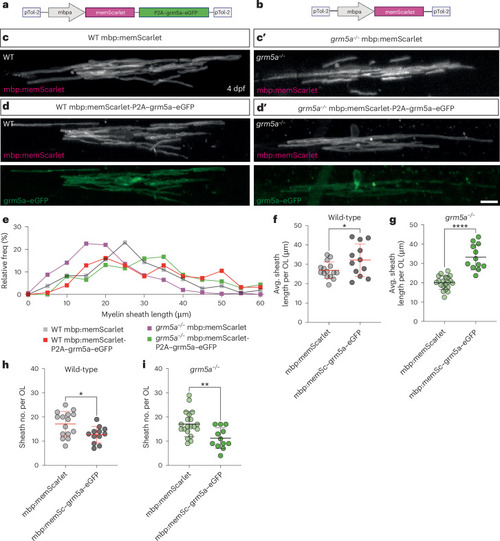
Oligodendrocyte-restricted expression of grm5a promotes myelin sheath elongation.

a, Construct used to express mGluR5 tethered to eGFP, alongside a membrane anchored reporter mScarlet, in myelinating oligodendrocytes. b, Control construct used to express fluorescent reporter in myelinating oligodendrocytes. c,c′, Images of oligodendrocytes expressing control mbp:memScarlet in wild-type (WT) (c) (N = 15) and grm5a−/− (c′) (N = 20) animals at 4 dpf. d,d′, Oligodendrocytes expressing mbp:memScarlet-P2A–grm5a–eGFP in WT (d) (N = 12) and grm5a−/− (d′) (N = 12) animals at 4 dpf. Scale bar, 10 μm. e, Relative frequency distribution of individual myelin sheath lengths. WT mbp:memScarlet n = 265 (mean 26.49 µm); WT mbp:memScarlet-P2A–grm5a–eGFP n = 124 (mean 31.55 µm); grm5a−/− mbp:memScarlet n = 365 (mean 19.54 µm); grm5a−/− mbp:memScarlet-P2A–grm5a–eGFP n = 138 (mean 31.58 µm). f, Mean sheath length of WT oligodendrocytes expressing mbp:memScarlet-P2A–grm5a–eGFP (N = 12, 32.19 ± 8.41) or mbp:memScarlet (N = 15, 26.92 ± 4.28) (two-sided unpaired t-test, P = 0.0445). g, Mean myelin sheath length of grm5a−/− oligodendrocytes expressing mbp:memScarlet-P2A–grm5a–eGFP (N = 12, 33.25 ± 6.57) or mbp:memScarlet (N = 20, 20.05 ± 3.45) (two-sided unpaired t-test, P = <0.0001). h, Sheath number per oligodendrocytes expressing mbp:memScarlet-P2A–grm5a–eGFP (12.67 ± 3.46) or mbp:memScarlet (17.13 ± 5.17) (two-sided unpaired t-test, P = 0.0164). i, Sheath number per oligodendrocytes in grm5a−/− mutants expressing mbp:memScarlet-P2A–grm5a–eGFP (N = 12, 11.25 ± 4.33) or mbp:memScarlet (N = 20, 17.1 ± 5.21) (two-sided unpaired t-test, P = 0.0027). Scale bar, 10 μm. Data show mean ± s.d.

Source data

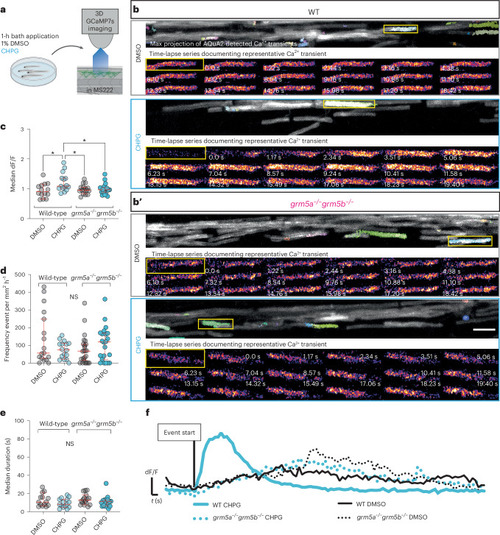
Endogenous mGluR5 is required for CHPG-induced high-amplitude myelin Ca2+ transients to occur.

a, Schematic of treatment of larvae and live imaging of Ca2+ activity in myelin sheaths. b,b′, Top shows representative maximum time series projections of Tg(mbp:memGCaMP7s) fluorescence with Ca2+ transients detected by AQuA2 false-colored automatically; bottom show single time-point images from the time-lapse series and highlight transients identified within yellow boxes. WT (N = 14) (b) and grm5a−/−grm5b−/− animals (b′) (N = 16) treated with vehicle and CHPG (WT N = 15; grm5a−/−grm5b−/−N = 17). Scale bar, 10 µm. c, Median amplitude (dF/F) of Ca2+ transients per fish (one-way ANOVA; P = 0.0079; Tukey’s multiple comparison test; WT DMSO versus CHPG P = 0.111, WT DMSO versus grm5a−/−grm5b−/− DMSO P = 0.9633; WT DMSO versus grm5a−/−grm5b−/− CHPG P = 0.9210, WT CHPG versus grm5a−/−grm5b−/− DMSO P = 0.0310, WT CHPG versus grm5a−/−grm5b−/− CHPG P = 0.0407; grm5a−/−grm5b−/− CHPG versus grm5a−/−grm5b−/− DMSO P = 0.9987) (WT DMSO N = 14, 0.94 ± 0.24, WT CHPG N = 15, 1.21 ± 0.31, grm5a−/−grm5b−/− DMSO N = 16, 0.98 ± 0.16, grm5a−/−grm5b−/− CHPG N = 17, 0.99 ± 0.19). d, Frequency of myelin Ca2+ transients in CHPG and DMSO-treated grm5a−/−grm5b−/− mutant and WT animals (one-way ANOVA P = 0.1658; Holm–Šídák’s multiple comparisons tests: WT DMSO versus WT CHPG P = 0.3022; WT DMSO versus grm5a−/−grm5b−/− DMSO P = 0.2591; WT CHPG versus grm5a−/−grm5b−/− DMSO P = 0.9840; WT CHPG versus grm5a−/−grm5b−/− CHPG P = 0.6868; WT DMSO versus grm5a−/−grm5b−/− CHPG P = 0.6868). WT DMSO 138 ± 149.2, WT CHPG 74.39 ± 48.68, grm5a−/−grm5b-/, DMSO 75.04 ± 82.95, grm5a−/−grm5b−/− CHPG 108.9 ± 95.43. Scale bar, 10 µm. e, Median duration of Ca2+ transients per fish (one-way ANOVA P = 0.2687; Tukey’s multiple comparisons test: WT DMSO versus WT CHPG P = 0.4745; WT DMSO versus grm5a−/−grm5b−/− DMSO P = 0.9864; WT DMSO versus grm5a−/−grm5b−/− CHPG P = 0.8633; WT CHPG versus grm5a−/−grm5b−/− DMSO P = 0.2638, WT CHPG versus grm5a−/−grm5b−/− CHPG P = 0.08864; grm5a−/−grm5b−/− DMSO versus grm5a−/−grm5b−/− CHPG P = 0.6516). WT DMSO 12.76 ± 6.964, WT CHPG 9.495 ± 5.044, grm5a−/−grm5b−/−, DMSO 13.52 ± 5.936, grm5a−/−grm5b−/−, CHPG 11.06 ± 6.233. f, Ca2+ transient dF/F traces of the events shown in corresponding conditions in b and b'. Data show mean ± s.d.

Source data

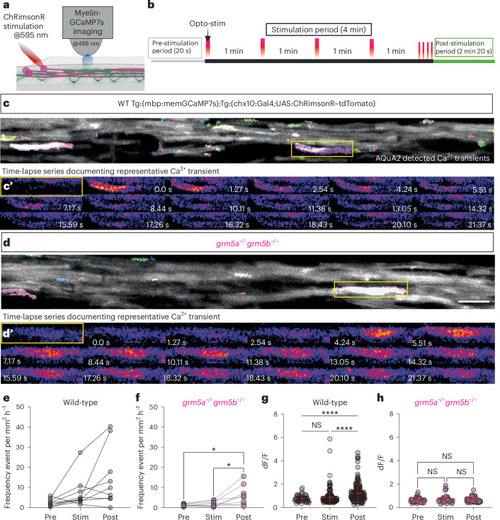
Opto-stimulation of neuronal activity induces mGluR5-dependent high-amplitude myelin Ca2+ transients.

a, Opto-stimulation of ChRimsonR-expressing Chx10 interneurons is carried out during continuous time-lapse imaging of myelin Ca2+ transients in Tg(mbp:memGCaMP7s) animals. b, Optogenetic-stimulation paradigm, consisting of the pre-stimulation period ‘pre’ (gray), stimulation period ‘stim’ (black; single opto-stimulation/light pulse (red) per min, ending with 4× stimulations within 10 s) and post-stimulation period (green). c, Maximum projection of AQuA2-detected Ca2+ transients in a WT Tg(chx10:Gal4 UAS:ChRimsonR–tdTomato;mbp:memGCaMP7s) animal at 4 dpf. c′, Individual frames of time series showing the increase in fluorescence associated with myelin Ca2+ transient indicated by boxed area in c. d, Maximum projection of AQuA2-detected Ca2+ transients in a grm5a−/−grm5b−/−, Tg(chx10:Gal4 UAS:ChRimsonR–tdTomato; mbp:memGCaMP7s) animal at 4 dpf. Scale bar, 10 µm. d′, Individual frames of time series showing the increase in fluorescence associated with myelin Ca2+ transient indicated by boxed area in d. e, Frequency of myelin Ca2+ transients in WT animals across pre, stim and post-stim periods (two-sided Friedman test P = 0.0103; multiple comparisons test: pre versus stim P = 0.1017; pre versus post P = 0.0140; stim. versus post P > 0.9999) (WT N = 9, WT pre 2.55 ± 1.83, WT stim 7.51 ± 7.95; WT post 14.97 ± 14.75). f, Frequency of myelin Ca2+ transients per grm5a−/−grm5b−/− animals over time across pre, stim and post-stim periods (two-sided Friedman test P = 0.008; multiple comparisons test: pre versus stim P > 0.9999; pre versus post: P = 0.0179; stim versus post P = 0.0373) (grm5a−/−grm5b−/−N = 8, grm5a−/−grm5b−/− pre 1.28 ± 0.53; grm5a−/−grm5b−/− stim 1.93 ± 1.39; grm5a−/−grm5b−/− post 6.34 ± 5.06). g, Individual WT Ca2+ amplitudes separated into three periods, pre (n = 65), stim (n = 175) and post-stimulation (n = 173) (One-way ANOVA, P = <0.0001, Kruskal–Wallis test multiple comparison: pre versus stim P > 0.9999; pre versus post P < 0.0001, stim versus post P < 0.0001) WT pre 0.76 ± 0.25, WT stim 0.88 ± 0.61 WT post 1.22 ± 0.78. h, Individual grm5a−/−grm5b−/− Ca2+ amplitudes separated into the three periods, pre (n = 50), stim (n = 45) and post-stimulation (n = 45) (one-way ANOVA, Kruskal–Wallis test P= 0.6768, Dunn’s multiple comparison, pre versus stim P > 0.9999; pre versus post P > 0.9999, stim versus post P > 0.9999) grm5a−/−grm5b−/− pre 0.63 ± 0.19, grm5a−/−grm5b−/− stim 0.69 ± 0.34 grm5a−/−grm5b−/− post 0.66 ± 0.20. Scale bar, 10 µm. Data are shown as mean ± s.d.

Source data

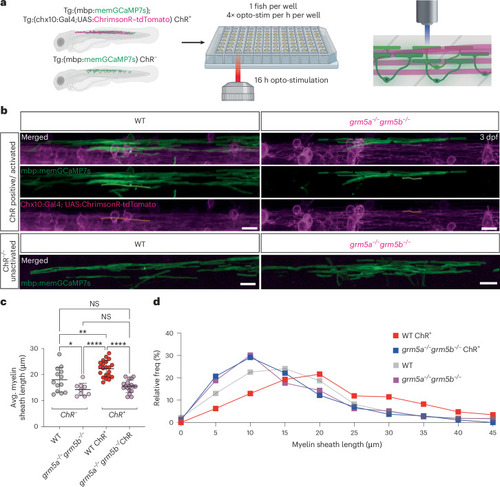
mGluR5 mediates myelin sheath growth in response to opto-stimulation of chx10 interneurons.

a, Experimental setup for long-term (16 h) opto-stimulation of individual ChRimsonR-positive and -negative Tg(mbp:memGCaMP7s) fish. Fish were screened for transgenesis, responsiveness to opto-stimulation and placed in individual wells of a 96-well plate and optically stimulated for 16 h before myelin morphology was assessed. b, Representative images, following 16 h of opto-stimulation, of a WT (left) and grm5a−/−grm5b−/− mutant (right) expressing Tg(chx10:ChRimsonR–tdTomato;mbp:memGCaMP7s) (ChR+) (WT N = 21, grm5a−/−grm5b−/−N = 18) (top). Representative images of Tg(mbp:memGCaMP7s), ChRimsonR–tdTomato negative (ChR) WT (left) and grm5a−/−grm5b−/− mutants (right) following 16 h of opto-stimulation (WT N = 13, grm5a−/−grm5b−/−N = 9) (bottom). Scale bar, 10 µm. c, Avg. myelin sheath length per WT and grm5a−/−grm5b−/− ChR+ and ChR animals (one-way ANOVA; P < 0.0001; Tukey’s multiple comparisons; WT ChR+ versus WT ChRP = 0.0032; WT ChR+ versus grm5a−/−grm5b−/− ChR+P < 0.0001; WT ChR+ versus grm5a−/−grm5b−/− ChRP < 0.0001; WT ChR versus grm5a−/−grm5b−/− ChR+P = 0.1636; WT ChR versus grm5a−/−grm5b−/− ChRP = 0.0488; grm5a−/−grm5b−/− ChR+ versus grm5a−/−grm5b−/− ChRP = 0.7810) WT ChRN = 13, 18.02 ± 4.73 WT ChR+N = 21, 22.24 ± 3.16 grm5a−/−grm5b−/− ChRN = 18, 14.24 ± 2.44 grm5a−/−grm5b−/− ChR+N = 18, 15.51 ± 2.40. d: Relative frequency distribution of individual sheath lengths, measured post-stimulation (WT ChR+n = 462, 21.67 µm; WT ChRn = 315, 16.23 µm; grm5a−/−grm5b−/− ChR+n = 271, 14.04 µm; grm5a−/−grm5b−/− ChRn = 271, 15.11 µm). Data are shown as mean ± s.d.

Source data

Acknowledgments
This image is the copyrighted work of the attributed author or publisher, and ZFIN has permission only to display this image to its users. Additional permissions should be obtained from the applicable author or publisher of the image. Full text @ Nat. Neurosci.