|
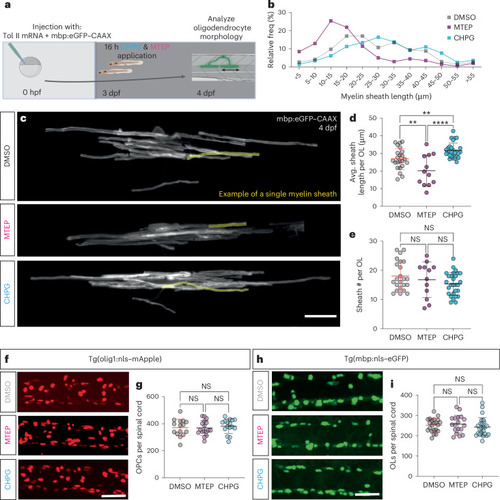
mGluR5 stimulation increases myelin sheath length without affecting cell number. a, Protocol to label individual oligodendrocytes, manipulate mGluR5 activity and assess myelination. b, Relative frequency of sheath lengths (DMSO n = 427, mean 16.79 µm; MTEP n = 201, mean 18.41 µm; CHPG n = 470, mean 30.44 µm). c, Individual oligodendrocytes at 4 dpf, labeled with mbp:eGFP–CAAX, after treatment with DMSO, mGluR5 antagonist MTEP and allosteric agonist CHPG. Scale bar, 15 µm. d, Mean sheath length per oligodendrocyte (one OL/fish) post treatment (one-way analysis of variance (ANOVA), P < 0.0001; Holm–Šídák’s multiple comparisons test: DMSO versus CHPG P = 0.0062, DMSO versus MTEP P = 0.0047; CHPG versus MTEP P < 0.0001). 1% DMSO (N = 23, 26.90 µm ± 6.031), CHPG (N = 28, 31.66 µm ± 4.27) and MTEP (N = 12, 20.15 µm ± 8.77). e, Number of myelin sheaths produced by single oligodendrocytes (one-way ANOVA; P = 0.2090, Kruskal–Wallis DMSO versus CHPG P = 0.2477; DMSO versus MTEP P > 0.9999; CHPG versus MTEP P > 0.9999). DMSO, N = 23, 18.04 ± 4.995; MTEP, N = 12, 16.75 ± 3.89; CHPG N = 28, 15.32 ± 6.08). Scale bar, 50 µm. f, Representative images of Tg(olig1:nls–mApple) after pharmacological manipulation of mGluR5. Scale bar, 50 µm. g, Number OPCs in the spinal cord (one-way ANOVA; P = 0.7774; Tukey’s multiple comparisons test, DMSO versus MTEP P = 0.9908; DMSO versus CHPG P = 0.8579; CHPG versus MTEP P = 0.7781), DMSO (N = 15); CHPG (N = 17); MTEP (N = 16). DMSO 371.1 ± 62.39; MTEP 368.5 ± 54.37; CHPG 381.8 ± 53.13. h, Representative images of Tg(mbp:nls–eGFP) after pharmacological manipulation of mGluR5. i, Number of myelinating oligodendrocytes in the spinal cord (one-way ANOVA; P = 0.5155; Tukey’s multiple comparisons test: DMSO versus MTEP P = 0.9141; DMSO versus CHPG P = 0.7359; CHPG versus MTEP P = 0.5037), DMSO (N = 22); CHPG (N = 25); MTEP (N = 18). DMSO, 252 ± 33.24; MTEP, 257.3 ± 43.61; CHPG, 243 ± 45.46. Scale bar, 50 µm. Data indicate mean ± s.d. Source data
|