|
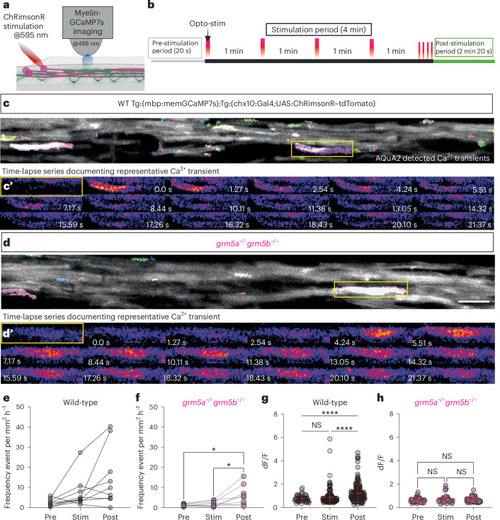
Opto-stimulation of neuronal activity induces mGluR5-dependent high-amplitude myelin Ca2+ transients. a, Opto-stimulation of ChRimsonR-expressing Chx10 interneurons is carried out during continuous time-lapse imaging of myelin Ca2+ transients in Tg(mbp:memGCaMP7s) animals. b, Optogenetic-stimulation paradigm, consisting of the pre-stimulation period ‘pre’ (gray), stimulation period ‘stim’ (black; single opto-stimulation/light pulse (red) per min, ending with 4× stimulations within 10 s) and post-stimulation period (green). c, Maximum projection of AQuA2-detected Ca2+ transients in a WT Tg(chx10:Gal4 UAS:ChRimsonR–tdTomato;mbp:memGCaMP7s) animal at 4 dpf. c′, Individual frames of time series showing the increase in fluorescence associated with myelin Ca2+ transient indicated by boxed area in c. d, Maximum projection of AQuA2-detected Ca2+ transients in a grm5a−/−grm5b−/−, Tg(chx10:Gal4 UAS:ChRimsonR–tdTomato; mbp:memGCaMP7s) animal at 4 dpf. Scale bar, 10 µm. d′, Individual frames of time series showing the increase in fluorescence associated with myelin Ca2+ transient indicated by boxed area in d. e, Frequency of myelin Ca2+ transients in WT animals across pre, stim and post-stim periods (two-sided Friedman test P = 0.0103; multiple comparisons test: pre versus stim P = 0.1017; pre versus post P = 0.0140; stim. versus post P > 0.9999) (WT N = 9, WT pre 2.55 ± 1.83, WT stim 7.51 ± 7.95; WT post 14.97 ± 14.75). f, Frequency of myelin Ca2+ transients per grm5a−/−grm5b−/− animals over time across pre, stim and post-stim periods (two-sided Friedman test P = 0.008; multiple comparisons test: pre versus stim P > 0.9999; pre versus post: P = 0.0179; stim versus post P = 0.0373) (grm5a−/−grm5b−/−N = 8, grm5a−/−grm5b−/− pre 1.28 ± 0.53; grm5a−/−grm5b−/− stim 1.93 ± 1.39; grm5a−/−grm5b−/− post 6.34 ± 5.06). g, Individual WT Ca2+ amplitudes separated into three periods, pre (n = 65), stim (n = 175) and post-stimulation (n = 173) (One-way ANOVA, P = <0.0001, Kruskal–Wallis test multiple comparison: pre versus stim P > 0.9999; pre versus post P < 0.0001, stim versus post P < 0.0001) WT pre 0.76 ± 0.25, WT stim 0.88 ± 0.61 WT post 1.22 ± 0.78. h, Individual grm5a−/−grm5b−/− Ca2+ amplitudes separated into the three periods, pre (n = 50), stim (n = 45) and post-stimulation (n = 45) (one-way ANOVA, Kruskal–Wallis test P = 0.6768, Dunn’s multiple comparison, pre versus stim P > 0.9999; pre versus post P > 0.9999, stim versus post P > 0.9999) grm5a−/−grm5b−/− pre 0.63 ± 0.19, grm5a−/−grm5b−/− stim 0.69 ± 0.34 grm5a−/−grm5b−/− post 0.66 ± 0.20. Scale bar, 10 µm. Data are shown as mean ± s.d. Source data
|