IMAGE

Fig. 4

ID
ZDB-IMAGE-250619-4
Source
Figures for Braaker et al., 2025
Image
Figure Caption

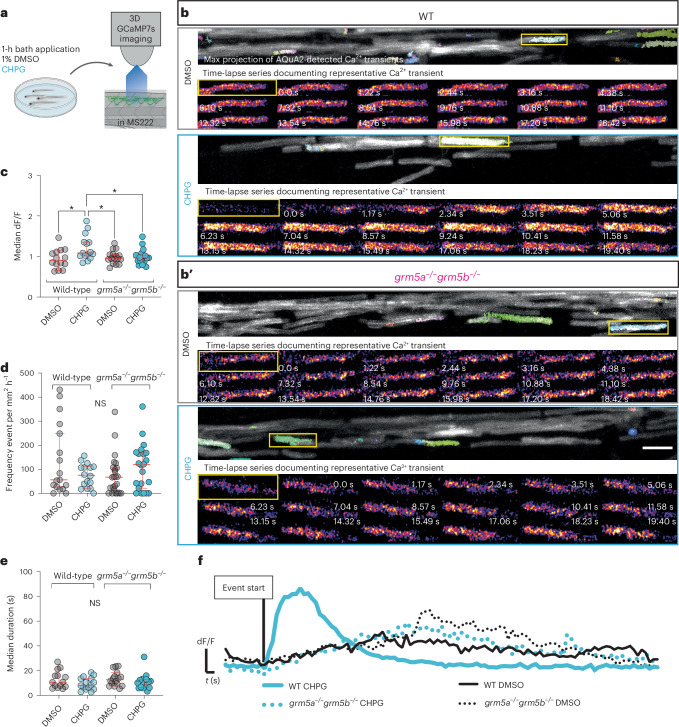
Fig. 4 Endogenous mGluR5 is required for CHPG-induced high-amplitude myelin Ca2+ transients to occur.

a, Schematic of treatment of larvae and live imaging of Ca2+ activity in myelin sheaths. b,b′, Top shows representative maximum time series projections of Tg(mbp:memGCaMP7s) fluorescence with Ca2+ transients detected by AQuA2 false-colored automatically; bottom show single time-point images from the time-lapse series and highlight transients identified within yellow boxes. WT (N = 14) (b) and grm5a−/−grm5b−/− animals (b′) (N = 16) treated with vehicle and CHPG (WT N = 15; grm5a−/−grm5b−/−N = 17). Scale bar, 10 µm. c, Median amplitude (dF/F) of Ca2+ transients per fish (one-way ANOVA; P = 0.0079; Tukey’s multiple comparison test; WT DMSO versus CHPG P = 0.111, WT DMSO versus grm5a−/−grm5b−/− DMSO P = 0.9633; WT DMSO versus grm5a−/−grm5b−/− CHPG P = 0.9210, WT CHPG versus grm5a−/−grm5b−/− DMSO P = 0.0310, WT CHPG versus grm5a−/−grm5b−/− CHPG P = 0.0407; grm5a−/−grm5b−/− CHPG versus grm5a−/−grm5b−/− DMSO P = 0.9987) (WT DMSO N = 14, 0.94 ± 0.24, WT CHPG N = 15, 1.21 ± 0.31, grm5a−/−grm5b−/− DMSO N = 16, 0.98 ± 0.16, grm5a−/−grm5b−/− CHPG N = 17, 0.99 ± 0.19). d, Frequency of myelin Ca2+ transients in CHPG and DMSO-treated grm5a−/−grm5b−/− mutant and WT animals (one-way ANOVA P = 0.1658; Holm–Šídák’s multiple comparisons tests: WT DMSO versus WT CHPG P = 0.3022; WT DMSO versus grm5a−/−grm5b−/− DMSO P = 0.2591; WT CHPG versus grm5a−/−grm5b−/− DMSO P = 0.9840; WT CHPG versus grm5a−/−grm5b−/− CHPG P = 0.6868; WT DMSO versus grm5a−/−grm5b−/− CHPG P = 0.6868). WT DMSO 138 ± 149.2, WT CHPG 74.39 ± 48.68, grm5a−/−grm5b-/, DMSO 75.04 ± 82.95, grm5a−/−grm5b−/− CHPG 108.9 ± 95.43. Scale bar, 10 µm. e, Median duration of Ca2+ transients per fish (one-way ANOVA P = 0.2687; Tukey’s multiple comparisons test: WT DMSO versus WT CHPG P = 0.4745; WT DMSO versus grm5a−/−grm5b−/− DMSO P = 0.9864; WT DMSO versus grm5a−/−grm5b−/− CHPG P = 0.8633; WT CHPG versus grm5a−/−grm5b−/− DMSO P = 0.2638, WT CHPG versus grm5a−/−grm5b−/− CHPG P = 0.08864; grm5a−/−grm5b−/− DMSO versus grm5a−/−grm5b−/− CHPG P = 0.6516). WT DMSO 12.76 ± 6.964, WT CHPG 9.495 ± 5.044, grm5a−/−grm5b−/−, DMSO 13.52 ± 5.936, grm5a−/−grm5b−/−, CHPG 11.06 ± 6.233. f, Ca2+ transient dF/F traces of the events shown in corresponding conditions in b and b'. Data show mean ± s.d.

Source data

Acknowledgments
This image is the copyrighted work of the attributed author or publisher, and ZFIN has permission only to display this image to its users. Additional permissions should be obtained from the applicable author or publisher of the image. Full text @ Nat. Neurosci.