FIGURE SUMMARY
Title

Tie2 activity in cancer associated myofibroblasts serves as novel target against reprogramming of cancer cells to embryonic-like cell state and associated poor prognosis in oral carcinoma patients

Authors
Mitra, P., Saha, U., Stephen, K.J., Prasad, P., Jena, S., Patel, A.K., Bv, H., Mondal, S.K., Kurkalang, S., Roy, S., Ghosh, A., Roy, S.S., Das Sarma, J., Biswas, N.K., Acharya, M., Sharan, R., Arun, P., Jolly, M.K., Maitra, A., Singh, S.
Source
Full text @ J. Exp. Clin. Cancer Res.

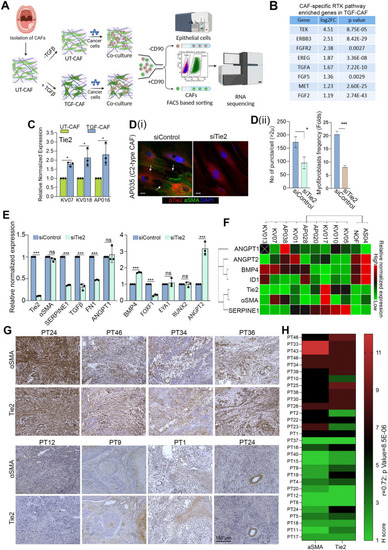
C2-CAF expressed higher levels of Tie2 and positively correlated with αSMA-high stromal fibroblasts in primary tumors.(A) A schematic depicting the experimental design for co-culture of UT-CAF and TGF-CAF with cancer cells and downstream processing. (B) List of eight common upregulated genes between RTK, PI3 K, MAPK in TGF-CAF. (C) qPCR analysis of Tie2 in three different primary CAF under untreated (UT-CAF) or 10 ng/ml TGFβ-induced (TGF-CAF) conditions. (D) (i) Images of constitutively activated C2-CAF (AP035), stained for aSMA (green), pTie2 (Y992) (Red), and nucleus (DAPI, purple) after RNAi mediated silencing of Tie2 (siTie2). Scrambled siRNA (siControl) was used as a control. Arrowhead indicates pTie2 (Y992) positive puncta. (ii) frequency of CAF with myofibroblast-phenotype (with aSMA- positive stress fiber) and pTie2 (Y992) puncta was quantified using ImageJ. Scale bars, 20 µm. (E) qPCR analysis of C1-CAF related genes (BMP4, EYA1, RUNX2, FOXF1, ANGPT2) and C2-CAF related genes (Tie2, TGFꞵ, SERPINE1, aSMA, FN1, ANGPT1) in constitutively activated C2-CAF following Tie2 knock-down. (F) Heatmap showing qPCR-based expression of C1- and C2- CAF related genes across different primary CAF from oral cancer patients and normal oral fibroblasts. (G) Representative images of human oral tumor tissues detected for αSMA and Tie2 protein expression using IHC. (H) Heatmap showing correlation between H-score of αSMA and Tie2 protein in oral tumor stroma. Scale bars = 20 µm. *P<0.05, **P<0.01, ***P<0.001

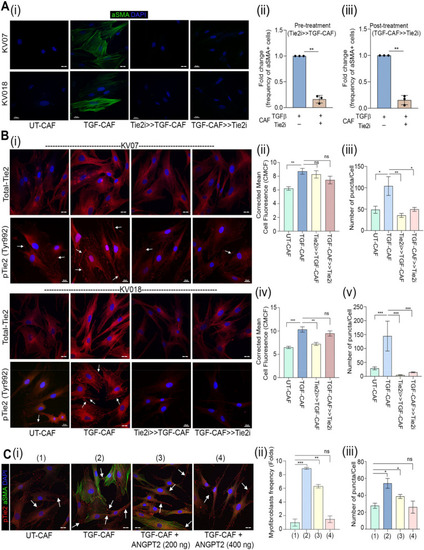
Tie2 plays essential role in induction as well as sustenance of TGFβ-induced myofibroblastic differentiation of CAF. (A) (i) Representative images and quantification of myofibroblasts frequency in UT-CAF and TGF-CAF. Tie2-inhibitor was added 1 h before TGFβ induction (Tie2i > > TGF-CAF) or 48 h after TGFβ induction (TGF-CAF > > Tie2i). Cells were quantified using ImageJ. (ii-iii) Frequency of αSMA stress fibre-positive cells were plotted for three different patient derived CAF. (B) (i) Representative images of Tie2 and pTie2 (Y992) in UT-CAF and TGF-CAF after Tie2-inhibition for 1 h before (Tie2i > > TGF-CAF) or 6 h after TGFβ induction (TGF-CAF > > Tie2i). (ii-v) Bar graph showing quantification of total Tie2 protein and pTie2 (Y992) puncta, calculated using ImageJ software. (C) (i) Representative images of αSMA and pTie2 (Y992) in UT-CAF, TGF-CAF or with increasing doses of ANGPT2 (200 ng/ml, 400 ng/ml) in the presence of TGFβ. Arrowhead indicates pTie2 (Y992) puncta. (ii) Bar graph showing cell frequency with αSMA stress fiber-positive CAF and (iii) pTie2 (Y992) expression by CAF in given conditions. Scale bar = 20 µm. *P < 0.05, **P < 0.01, ***P < 0.001

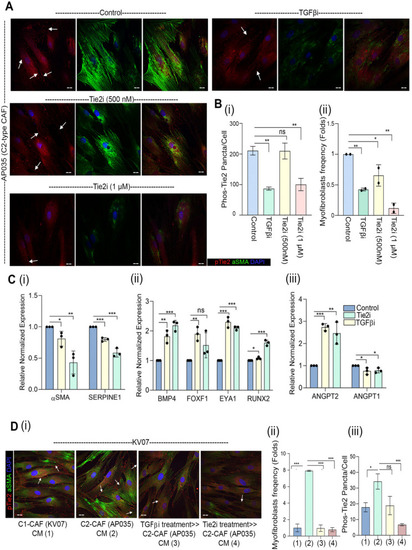
Tie2-activity is regulated in an autocrine manner.(A) Representative images of constitutively active C2-CAF (AP035) detected for αSMA and pTie2 (Y992) protein. Increasing doses of Tie2 inhibitor and TGFβ inhibitor (Galunisertib; 1µM) were used to block respective receptor activity. Cells were quantified using ImageJ software. (B) (i) quantification of pTie2 (Y992) puncta and (ii) myofibroblasts frequency under these conditions. (C) qPCR analysis of (i) C2-CAF related genes (SERPINE1, αSMA), (ii) C1-CAF related genes (BMP4, EYA1, RUNX2, FOXF1), and (iii) ligand of Tie2 receptor (ANGPT1, ANGPT2) following Tie2 inhibitor and TGFβ inhibitor treatment in constitutively activated C2-CAF. Unstimulated CAF in same media was used as control. (D) (i) Representative images of C1-CAF (KV07) exposed to conditioned media from C1-CAF (KV07), C2-CAF (AP035), TGFβ inhibited C2-CAF (TGFβi > C2 CAF), Tie2 inhibited C2-CAF (Tie2i > C2 CAF), for 48 h, detected for αSMA and pTie2 (Y992) (ii) myofibroblasts frequency and (iii) pTie2 (Y992) puncta was quantified using ImageJ. Arrowhead indicates pTie2 (Y992) puncta. Scale bar = 20 µm *P < 0.05, **P < 0.01, ***P < 0.001

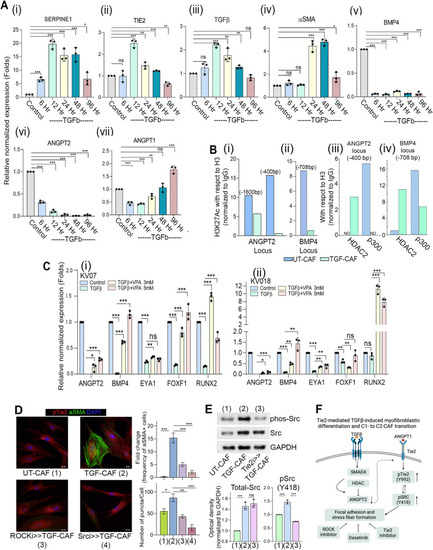
TGFβ-induced histone deacetylation drives transcriptional state changes associated with transition of C1- to C2-CAF.(A) (i-vii) qPCR analysis of SERPINE1, αSMA, TGFꞵ, Tie2, BMP4, ANGPT2 and ANGPT1 in C1-CAF following 10 ng/ml TGFβ stimulation in time dependent manner as indicated. Relative abundance of mRNA was normalized with unstimulated CAF (Control) of respective time points. (B) Chromatin immunoprecipitation analysis of H3 K27-acetylation status on (i) ANGPT2 (TATA binding site −1600 bp; initiator site −400 bp) and (ii) BMP4 promoter (−708 bp) in C1-CAF; as well as (iii) HDAC2 and p300 on ANGPT2 initiated (−400 bp) and (iv) BMP4 promoter (−708 bp) locus with 10 ng/ml TGFβ (TGF-CAF). Unstimulated CAF (UT-CAF) were used as control. Data is representative on number of copies detected by ddPCR relative to ChIP DNA for Histone H3. (C) qPCR analysis showing expression of C1-CAF related genes, BMP4, EYA1, RUNX2, FOXF1 and ANGPT2 with or without valproic acid (3 mM, 5 mM) in presence of 10 ng/ml TGFβ. Unstimulated CAF were used as control. (D) Representative images of αSMA and pTie2 (Y992) in UT-CAF and TGF-CAF. ROCK and SRC inhibition was done 1 h before (ROCKi > > TGFCAF or Srci > > TGFCAF) TGFβ-induction. Bar graph showing quantification of myofibroblasts frequency and pTie2 (Y992) puncta, calculated using ImageJ software. (E) Western blot analysis of the expression of pSRC and SRC in UT-CAF, TGF-CAF and Tie2i > > TGF-CAF. (F) Schematic model of HDAC-mediated suppression of C1-CAF related genes. Scale bar = 20 µm. *P < 0.05, **P < 0.01, ***P < 0.001

Endogenous-TGFβ is necessary and sufficient in driving Tie2-ANGPT signaling.(A) Representative images of ANGPT2 silenced C1-CAF with or without ANGPT1 stimulation (400 ng/ml) for 6 h, detected for pTie2 (Y992) protein. Scrambled siRNA was used as control. (B) qPCR analysis of ANGPT2 following ANGPT2 knockdown in C1 CAF. (C) Quantification of pTie2 (Y992) puncta using ImageJ. (D) Representative images of αSMA and pTie2 (Y992) protein detected by immunofluorescence staining, upon gene silencing of TGFβ, Tie2 and ANGPT1 in TGF-CAF. Scrambled siRNA was used as a control. (E) Myofibroblasts frequency and pTie2 (Y992) puncta was quantified using ImageJ. (F) qPCR analysis of TGFβ, Tie2, ANGPT1 and ANGPT2 followed by knockdown of TGFβ, Tie2 and ANGPT1 in TGF-CAF. (G) Schematic model suggesting experimental design of conditioned media (CM) collection from TGF-CAF following TGFβ, Tie2 and ANGPT1 gene knockdown. (H) Representative images showing myofibroblasts frequency in uninduced C1-CAF exposed to the CM collected from TGF-CAF after TGFβ, Tie2 or ANGPT1 gene-silencing. C1-CAF exposed to C1-CAF CM was used as control. Myofibroblasts frequency was quantified using ImageJ. Scale bar = 20 μm. *P < 0.05, **P < 0.01, ***P < 0.001

TGFβ-induced myofibroblastic C2-CAF reprograms oral-cancer cells to acquire embryonic-like transcriptome state.(A) Feature plot showing expressions of epithelial and CAF marker modules on UMAP projection from three conditions of co-cultures as indicated. Circled clusters are annotated as CAF clusters with high CAF marker module scores and negativity for epithelial markers module scores. (B) UMAP plot shows re-clustering of CAF clusters from all the three conditions merged, revealing 13 clusters with a total of 11,391 cells. A split view of major clusters in a sample specific manner is provided on side panel. (C) (i) An UMAP plot visualizing sample wise grouped CAF clusters. (ii) Monocle3 pseudotime -time analysis showing CAF dynamic transition along the trajectory. (D) Violin plot showing enrichment of TGFβ and Tie2 signaling AUC scores generated by R tool ‘AUCell’, upon TGFβ treatment of CAF, which was significantly decreased followed by Tie2-inhibition. (E) AUC scoring of CAF from classified patient groups (High BMP4 (C1-like)/High ITGA3 (C2-like)) from Puram et al. and Quah et al. HNSCC datasets shows significant enrichment of C1-CAF DEGs in High BMP4 group, and C2-CAF DEGs and Tie2 signaling in High ITGA3 group. (F) Subset of 32,354 epithelial cells from all three conditions were merged and re-clustered, identified 16 clusters, projected on UMAP plot. (G) Pseudotime analysis exploring transition trajectory of cancer cells. (H) Bubble plot showing GO biological process analysis of gene-set among single cell and bulk RNA sequencing of cancer cells co cultured with TGF-CAF. Size of bubble represents numbers of associated genes and colour corresponds to given p value

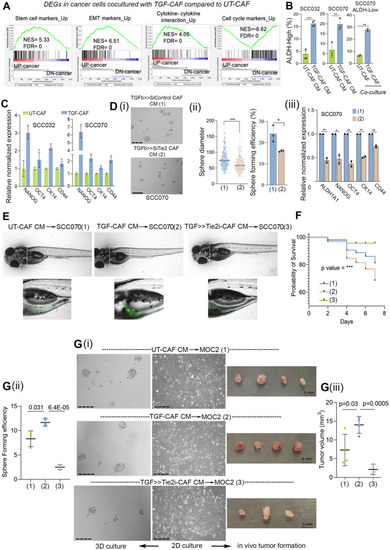
CAF-specific Tie2 regulates cancer cell plasticity and stemness in oral cancer cells.(A) Gene set enrichment analysis (GSEA) from transcriptome data of cancer cells, co-cultured with UT-CAF or TGF-CAF for four days. Datasets were obtained from MsigDB database. (B) Bar graph showing conversion of ALDH-Low cells into ALDH-High cells upon exposing to conditioned media of UT-CAF or TGF-CAF or upon co-culture as indicated. (C) qPCR analysis of stemness associated genes (OCT4, NANOG, CD44 and KRT14 (CK14) in two different oral cancer cell lines (SCC070 and SCC032) exposed to CM from KV07 or KV018 CAF, respectively. (D) (i) Representative image of 3D-spheroids of SCC070 cell line exposed to CM from TGFβ > > siTie2 or TGFβ > > siControl, followed by testing in spheroid formation assay. (ii) Dot plot showing diameter of formed spheroids of cancer cells from these conditions and bar graph showing sphere forming efficiency of cancer cells exposed to both these conditions. Sphere size was quantified using ImageJ. Spheres of < 60 µm diameter were excluded from study. (iii). qPCR analysis of stemness associated genes (ALDH1 A1, OCT4, NANOG, CD44 and KRT14/CK14) in cancer cells following exposed to CM from TGFβ > > siControl or TGFβ > > siTie2 in monolayer culture for 48 h. (E) Representative images of zebrafish xenografts taken using confocal microscope. GFP positive oral cancer cells (SCC070) were exposed to conditioned media of UT-CAF, TGF-CAF or TGF > > Tie2i-CAF for 48 h. Cells were harvested and 100 cells were inoculated into yolk sac of each zebrafish embryo (2-day post fertilization). GFP-positive cell colonies were visible on 4 th day of inoculation. (F) Kaplan Meier survival plots showing a probability of deaths in zebrafish embryos due to increased tumor burden. (G) (i) Representative phase contrast images of MOC2 cells cultured with conditioned media of UT-CAF, TGF-CAF and TGF > > Tie2i CAF for 48 h in monolayer culture (2D) and representative images of 3D spheroids of MOC2 cells exposed to CAF-CM from all three conditions as mentioned. (ii) Tree plot showing sphere forming efficiency of MOC2 cells exposed to conditioned media of UT-CAF, TGF-CAF and TGF > > Tie2i CAF. Spheres of < 60µ diameter were excluded from study. (iii) MOC2 cells cultured in conditioned media of UT-CAF, TGF-CAF and TGF > > Tie2i CAF for 48 h in monolayer culture. These CM exposed MOC2 cells (3 × 105 cells/mice) were subcutaneously inoculated into syngeneic C57BL/6 mouse models and monitored for 10 days. On day 10 th of transplantation, mice were sacrificed and tumors were harvested. Volume of these tumors were measured using ImageJ and plotted in GraphPad prism. **P < 0.05, **P < 0.01, ***P < 0.001. Scale bars, 275 µm

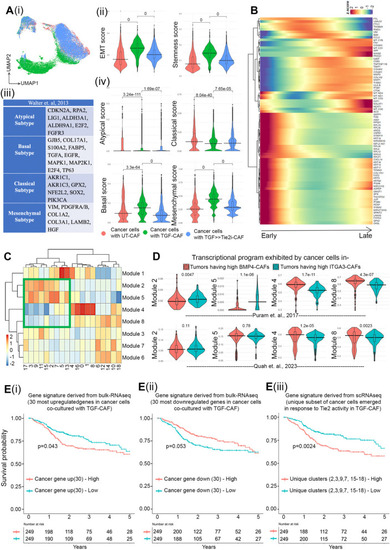
Tie2 responsive single cell gene expression data derived modules translate to clinical output of HNSCC patients.(A) (i) UMAP plot showing colour coded clustering of cancer cells co-cultured with UT-CAF, TGF-CAF and TGF > > Tie2i-CAF. (ii) Violin plot showing EMT and stemness AUC score generated by R tool ‘AUCell’. (iii) Table depicting gene expression based classified molecular subtypes of HNSCC signatures (from [47]) (iv) Pseudo-bulk analysis of AUCell scores over cancer cells co cultured with distinct CAF subtypes for the given molecular subtype gene signatures. (B) Heatmap showing trajectory variable gene expressions from early to late pseudotime. (C) Expression heatmap of co-regulatory gene modules for each cluster of merged cancer cell subset. Marked green box indicates similar expression pattern of module 2, module 5; and module 4, module 8 on exclusive Tie2 responsive cancer cell clusters. (D) AUC scoring of cancer cells from the aforementioned patient groups from Puram et al. and Quah et al. HNSCC datasets shows significant enrichment of modules 4 & 8 in High BMP4 group (C1-like CAF high tumors) in both datasets, and modules 2 & 5 in High ITGA3 group (C2-like CAF high tumors) in Puram et al. and Quah et. al. dataset. (E) Prediction of survival probability of TCGA HNSCC patients. Kaplan Meier plot showing survival probability of HNSCC patients harbouring gene signatures of (i)Top 30 upregulated or (ii)Top 30 downregulated genes of TGF-CAF cocultured cancer cells form bulk RNAseq data (iii) Survival probability of patients harbouring gene expression signature obtained from scRNAseq analysis of unique subset of cancer cells co-cultured with TGF-CAF, as mentioned

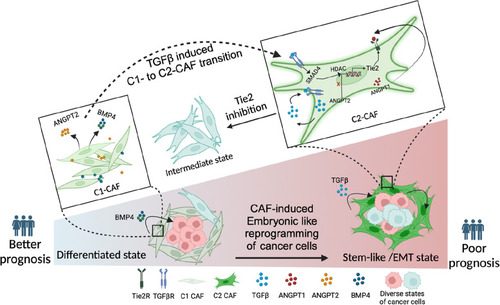
CAF-specific Tie2 activity in reprogramming of oral cancer cells. We have previously identified and characterized C1-CAF and C2-CAF in oral cancer. C1-CAFs exhibit higher-BMP4 expression, whereas C2-CAF exhibit myofibroblastic phenotype with aSMA-positive stress fiber formation. The C2-CAFs supported stem-like properties in cancer cells. Here, we have explored the possible mechanism and demonstrated that the TGFβ-induced myofibroblastic differentiation and conversion of C1-CAF into C2-CAF is mediated through the activation of Tie2-signaling with suppression of its antagonist-ANGPT2 due to HDAC-mediated deacetylation of its promoter. Furthermore, Tie2-inhibition was found to convert TGFβ-induced-CAF towards the transcriptional state of C1-CAF. Functionally, TGFβ-induced CAF reprogramed oral cancer cells into embryonic-like state with enhanced stemness and EMT properties. Emphasizing its clinical translational value, the specific gene-signature derived from the cancer cells, reprogrammed by TGFβ-induced Tie2-activated-CAF, may predict the poor prognosis in head and neck cancer patients

Acknowledgments
This image is the copyrighted work of the attributed author or publisher, and ZFIN has permission only to display this image to its users. Additional permissions should be obtained from the applicable author or publisher of the image. Full text @ J. Exp. Clin. Cancer Res.