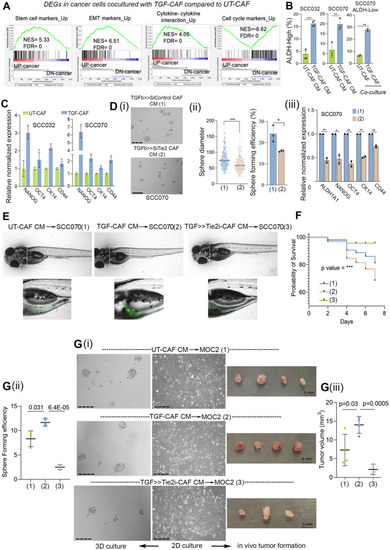
CAF-specific Tie2 regulates cancer cell plasticity and stemness in oral cancer cells.(A) Gene set enrichment analysis (GSEA) from transcriptome data of cancer cells, co-cultured with UT-CAF or TGF-CAF for four days. Datasets were obtained from MsigDB database. (B) Bar graph showing conversion of ALDH-Low cells into ALDH-High cells upon exposing to conditioned media of UT-CAF or TGF-CAF or upon co-culture as indicated. (C) qPCR analysis of stemness associated genes (OCT4, NANOG, CD44 and KRT14 (CK14) in two different oral cancer cell lines (SCC070 and SCC032) exposed to CM from KV07 or KV018 CAF, respectively. (D) (i) Representative image of 3D-spheroids of SCC070 cell line exposed to CM from TGFβ > > siTie2 or TGFβ > > siControl, followed by testing in spheroid formation assay. (ii) Dot plot showing diameter of formed spheroids of cancer cells from these conditions and bar graph showing sphere forming efficiency of cancer cells exposed to both these conditions. Sphere size was quantified using ImageJ. Spheres of < 60 µm diameter were excluded from study. (iii). qPCR analysis of stemness associated genes (ALDH1 A1, OCT4, NANOG, CD44 and KRT14/CK14) in cancer cells following exposed to CM from TGFβ > > siControl or TGFβ > > siTie2 in monolayer culture for 48 h. (E) Representative images of zebrafish xenografts taken using confocal microscope. GFP positive oral cancer cells (SCC070) were exposed to conditioned media of UT-CAF, TGF-CAF or TGF > > Tie2i-CAF for 48 h. Cells were harvested and 100 cells were inoculated into yolk sac of each zebrafish embryo (2-day post fertilization). GFP-positive cell colonies were visible on 4 th day of inoculation. (F) Kaplan Meier survival plots showing a probability of deaths in zebrafish embryos due to increased tumor burden. (G) (i) Representative phase contrast images of MOC2 cells cultured with conditioned media of UT-CAF, TGF-CAF and TGF > > Tie2i CAF for 48 h in monolayer culture (2D) and representative images of 3D spheroids of MOC2 cells exposed to CAF-CM from all three conditions as mentioned. (ii) Tree plot showing sphere forming efficiency of MOC2 cells exposed to conditioned media of UT-CAF, TGF-CAF and TGF > > Tie2i CAF. Spheres of < 60µ diameter were excluded from study. (iii) MOC2 cells cultured in conditioned media of UT-CAF, TGF-CAF and TGF > > Tie2i CAF for 48 h in monolayer culture. These CM exposed MOC2 cells (3 × 10⁵ cells/mice) were subcutaneously inoculated into syngeneic C57BL/6 mouse models and monitored for 10 days. On day 10 th of transplantation, mice were sacrificed and tumors were harvested. Volume of these tumors were measured using ImageJ and plotted in GraphPad prism. **P < 0.05, **P < 0.01, ***P < 0.001. Scale bars, 275 µm
|
