IMAGE

Fig. 1

ID
ZDB-IMAGE-250514-40
Source
Figures for Mitra et al., 2025
Image
Figure Caption

Fig. 1

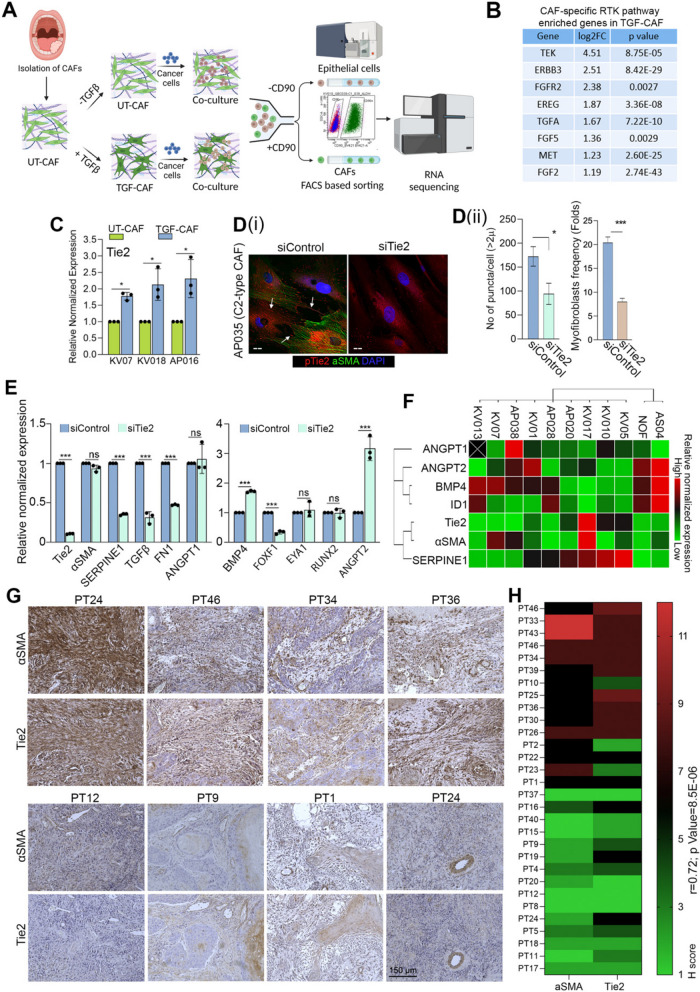
C2-CAF expressed higher levels of Tie2 and positively correlated with αSMA-high stromal fibroblasts in primary tumors.(A) A schematic depicting the experimental design for co-culture of UT-CAF and TGF-CAF with cancer cells and downstream processing. (B) List of eight common upregulated genes between RTK, PI3 K, MAPK in TGF-CAF. (C) qPCR analysis of Tie2 in three different primary CAF under untreated (UT-CAF) or 10 ng/ml TGFβ-induced (TGF-CAF) conditions. (D) (i) Images of constitutively activated C2-CAF (AP035), stained for aSMA (green), pTie2 (Y992) (Red), and nucleus (DAPI, purple) after RNAi mediated silencing of Tie2 (siTie2). Scrambled siRNA (siControl) was used as a control. Arrowhead indicates pTie2 (Y992) positive puncta. (ii) frequency of CAF with myofibroblast-phenotype (with aSMA- positive stress fiber) and pTie2 (Y992) puncta was quantified using ImageJ. Scale bars, 20 µm. (E) qPCR analysis of C1-CAF related genes (BMP4, EYA1, RUNX2, FOXF1, ANGPT2) and C2-CAF related genes (Tie2, TGFꞵ, SERPINE1, aSMA, FN1, ANGPT1) in constitutively activated C2-CAF following Tie2 knock-down. (F) Heatmap showing qPCR-based expression of C1- and C2- CAF related genes across different primary CAF from oral cancer patients and normal oral fibroblasts. (G) Representative images of human oral tumor tissues detected for αSMA and Tie2 protein expression using IHC. (H) Heatmap showing correlation between H-score of αSMA and Tie2 protein in oral tumor stroma. Scale bars = 20 µm. *P<0.05, **P<0.01, ***P<0.001

Acknowledgments
This image is the copyrighted work of the attributed author or publisher, and ZFIN has permission only to display this image to its users. Additional permissions should be obtained from the applicable author or publisher of the image. Full text @ J. Exp. Clin. Cancer Res.