IMAGE

Fig. 3

ID
ZDB-IMAGE-250514-42
Source
Figures for Mitra et al., 2025
Image
Figure Caption

Fig. 3

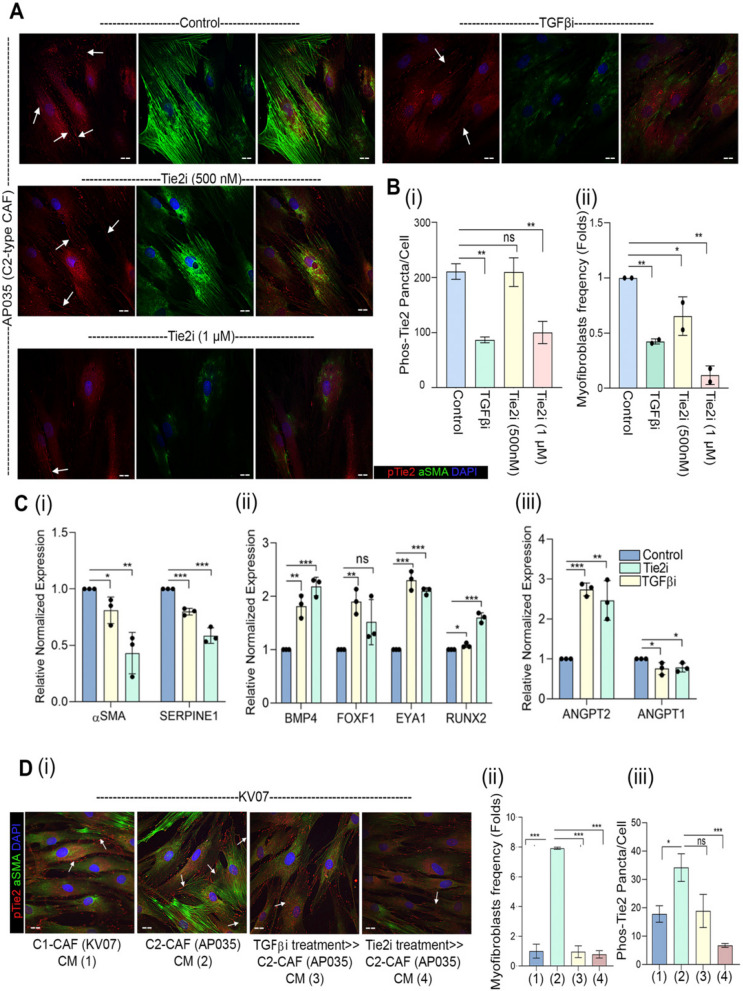
Tie2-activity is regulated in an autocrine manner.(A) Representative images of constitutively active C2-CAF (AP035) detected for αSMA and pTie2 (Y992) protein. Increasing doses of Tie2 inhibitor and TGFβ inhibitor (Galunisertib; 1µM) were used to block respective receptor activity. Cells were quantified using ImageJ software. (B) (i) quantification of pTie2 (Y992) puncta and (ii) myofibroblasts frequency under these conditions. (C) qPCR analysis of (i) C2-CAF related genes (SERPINE1, αSMA), (ii) C1-CAF related genes (BMP4, EYA1, RUNX2, FOXF1), and (iii) ligand of Tie2 receptor (ANGPT1, ANGPT2) following Tie2 inhibitor and TGFβ inhibitor treatment in constitutively activated C2-CAF. Unstimulated CAF in same media was used as control. (D) (i) Representative images of C1-CAF (KV07) exposed to conditioned media from C1-CAF (KV07), C2-CAF (AP035), TGFβ inhibited C2-CAF (TGFβi > C2 CAF), Tie2 inhibited C2-CAF (Tie2i > C2 CAF), for 48 h, detected for αSMA and pTie2 (Y992) (ii) myofibroblasts frequency and (iii) pTie2 (Y992) puncta was quantified using ImageJ. Arrowhead indicates pTie2 (Y992) puncta. Scale bar = 20 µm *P < 0.05, **P < 0.01, ***P < 0.001

Acknowledgments
This image is the copyrighted work of the attributed author or publisher, and ZFIN has permission only to display this image to its users. Additional permissions should be obtained from the applicable author or publisher of the image. Full text @ J. Exp. Clin. Cancer Res.