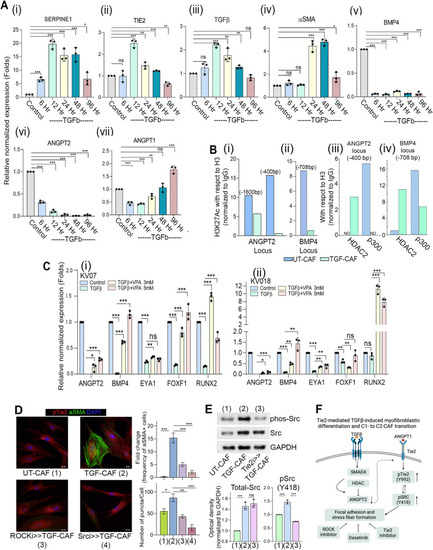
TGFβ-induced histone deacetylation drives transcriptional state changes associated with transition of C1- to C2-CAF.(A) (i-vii) qPCR analysis of SERPINE1, αSMA, TGFꞵ, Tie2, BMP4, ANGPT2 and ANGPT1 in C1-CAF following 10 ng/ml TGFβ stimulation in time dependent manner as indicated. Relative abundance of mRNA was normalized with unstimulated CAF (Control) of respective time points. (B) Chromatin immunoprecipitation analysis of H3 K27-acetylation status on (i) ANGPT2 (TATA binding site −1600 bp; initiator site −400 bp) and (ii) BMP4 promoter (−708 bp) in C1-CAF; as well as (iii) HDAC2 and p300 on ANGPT2 initiated (−400 bp) and (iv) BMP4 promoter (−708 bp) locus with 10 ng/ml TGFβ (TGF-CAF). Unstimulated CAF (UT-CAF) were used as control. Data is representative on number of copies detected by ddPCR relative to ChIP DNA for Histone H3. (C) qPCR analysis showing expression of C1-CAF related genes, BMP4, EYA1, RUNX2, FOXF1 and ANGPT2 with or without valproic acid (3 mM, 5 mM) in presence of 10 ng/ml TGFβ. Unstimulated CAF were used as control. (D) Representative images of αSMA and pTie2 (Y992) in UT-CAF and TGF-CAF. ROCK and SRC inhibition was done 1 h before (ROCKi > > TGFCAF or Srci > > TGFCAF) TGFβ-induction. Bar graph showing quantification of myofibroblasts frequency and pTie2 (Y992) puncta, calculated using ImageJ software. (E) Western blot analysis of the expression of pSRC and SRC in UT-CAF, TGF-CAF and Tie2i > > TGF-CAF. (F) Schematic model of HDAC-mediated suppression of C1-CAF related genes. Scale bar = 20 µm. *P < 0.05, **P < 0.01, ***P < 0.001
|
