
- Title
-
kcnb1 loss of function in zebrafish causes neurodevelopmental and epileptic disorders associated with γ-aminobutyric acid dysregulation
- Authors
- Robichon, L., Bar, C., Marian, A., Lehmann, L., Renault, S., Kabashi, E., Ciura, S., Nabbout, R.
- Source
- Full text @ Epilepsia
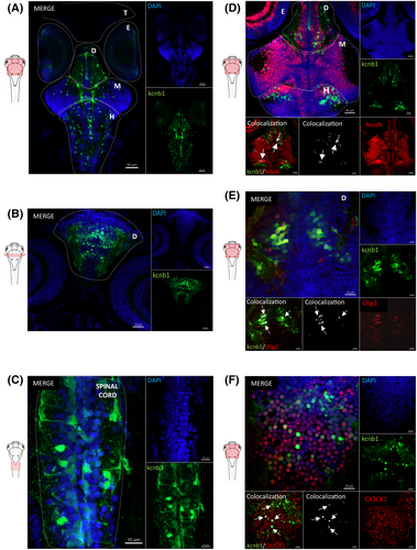
kcnb1 is expressed in distinct cell subtypes and various regions of the central nervous system in 6 days post fertilization (dpf) wild-type (WT) zebrafish. (A, B) Horizontal and transversal sections of WT zebrafish expressing cells (4,6-diamidino-2-phenylindole [DAPI]; blue) labeled with anti-kcnb1 (green), showing a large expression of the protein in the central nervous system (CNS) at 6 dpf. The protein is expressed in the telencephalon, diencephalon, midbrain including the optic tectum, and hindbrain comprising the cerebellum and the spinal cord (A: scale bar = 50 μm, magnification = 10×; B: scale bar = 30 μm, magnification 20×). (C) Horizontal section of a WT zebrafish at 6 dpf showing the presence of kcnb1 along the spinal cord (scale bar = 10 μm, magnification = 63×). (D–F) Horizontal sections of 6-dpf WT zebrafish expressing cells (DAPI; blue), kcnb1 (green), and specific cell subtype markers, respectively. (D) A neuronal nuclear marker (neuronal nuclear antigen [NeuN]; red, scale bar = 30 μm, magnification = 20×), (E) oligodendrocyte transcription factor 2 (Olig2; red, scale bar = 10 μm, magnification = 63×), and (F) CX3C motif chemokine receptor 1 expressed in microglial cells (CX3CR1; red, scale bar = 10 μm, magnification = 63×). Images demonstrate the colocalization between kcnb1 and the three different cell subtype markers, represented in white and marked by arrows. These results indicate the presence of kcnb1 in neurons, oligodendrocytes, and microglial cells. The colocalization was determined using Z-stack projection with IMARIS v10.1.0 software (Oxford Instruments). In figures, CNS regions are delimited by dotted lines. D, diencephalon; E, eyes; H, hindbrain; M: midbrain; T, telencephalon. n = 3–4/section. EXPRESSION / LABELING:
|
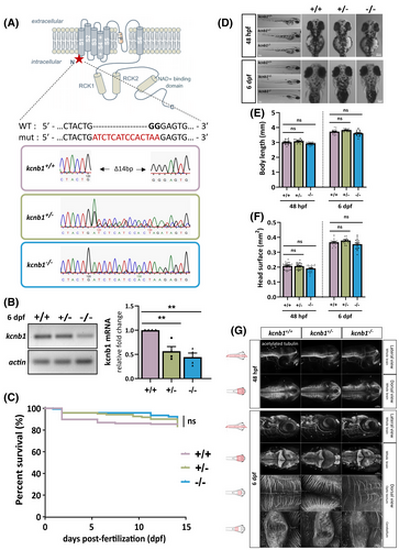
Genotypic characterization of a kcnb1 knockout (KO) zebrafish model without brain anatomical defects. (A) Schematic illustration of the generation of a kcnb1 KO zebrafish model obtained by Shen et al.40 The representation of the α-subunit kcnb1 is adapted from a previous schematic picture.44 Using the CRISPR-Cas9 (Clustered Regularly Interspaced Short Palindromic Repeats) system, the kcnb1 KO zebrafish model was generated by the insertion of a 14-bp nucleotide sequence (indicated in red) and of a 2-bp nucleotide deletion (indicated in black bold type) in the first exon of the gene, resulting in the introduction of a premature stop codon (∆14 bp), and localized between the N-terminal region and the first transmembrane domain of the protein (targeted sequence: GGAGCTGGACTACTGGGGAG in kcnb1 exon 1; ID zfin: ZDB-ALT-170417-2; indel mutation; line: kcnb1sq301/sq301). (B) Reverse transcription quantitative polymerase chain reaction analysis of total kcnb1 at 6 days post fertilization (dpf) demonstrating a significant decrease of kcnb1 mRNA in kcnb1+/− and kcnb1−/− compared with wild-type (WT; kcnb1+/+) larvae (N = 4; n = 30/sample; one-way analysis of variance [ANOVA] with Bonferroni post hoc test; **p < .01). Data are normalized to actin mRNA expression, and the condition kcnb1+/+ is considered as the reference value (relative fold change = 1). (C) Kaplan–Meier survival curve between 0 and 15 dpf showing that the loss of kcnb1 does not impact the normal growth of fish at early stages of development (see Table S1; N = 3; n = 121–169/genotype; log-rank test). (D) Images showing that kcnb1+/− and kcnb1−/− zebrafish do not show gross morphological changes at 48 hours post-fertilization (hpf) and 6 dpf (scale bar = 300 μm). (E, F) Quantification of major morphological aspects at 48 hpf and 6 dpf including measurement of (E) body length and (F) head surface. kcnb1 KO models (kcnb1+/− and kcnb1−/−) do not show any significant change in each parameter at different developmental stages as compared to kcnb1+/+ (N = 4; n = 28–38/genotype; one-way ANOVA with Bonferroni post hoc test). (G) Whole-mount images of embryonic (48 hpf) and larvae (6 dpf) zebrafish immunostained with anti-acetylated tubulin marker to identify global circuits of neuronal fibers (lateral and dorsal view; three-dimensional reconstruction; magnification = 20× with scale bar at 100 μm; magnification = 40× with scale bar at 20 μm). The loss of kcnb1 does not affect the neuronal brain density at different early stages of development (n = 5–7/genotype/developmental stage). ns, non-significant. |
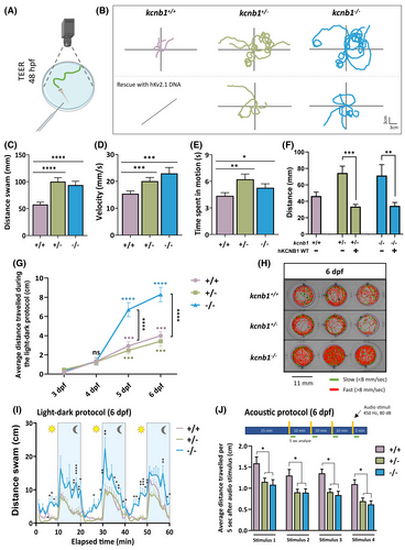
Loss of kcnb1 leads to an altered behavioral phenotype, and light- and sound-induced locomotor impairments. (A) Schematic representation of the touch-evoked escape response (TEER) test. The tail of a 48 hours post-fertilization (hpf) embryo is mechanically stimulated, and the swimming trajectory of zebrafish is recorded. (B) Top part: Representative traces of individual swimming episodes at 48 hpf showing the typical tortuous trajectory of kcnb1 knockout models (kcnb1+/− and kcnb1−/−) as compared to the straight-line trajectory of kcnb1+/+ zebrafish (5 trajectories/genotype). Bottom part: One-cell stage eggs from kcnb1+/− and kcnb1−/− zebrafish were microinjected with the hKv2.1 wild-type (WT) plasmid, and the trajectory of embryos was analyzed at 48 hpf using the TEER test. The expression of the hKv2.1-WT construct allowed the rescue of the locomotor phenotype of kcnb1 knockout models by reproducing a more linear trajectory similar to WT embryos. (C–E) The quantification of the swimming trajectory tortuosity shows a significant increase of different parameters studied in both kcnb1 knockout conditions as compared to kcnb1+/+ embryos, including an increase in (C) the distance swam, (D) the velocity, and (E) the time spent in motion. Furthermore, within the same genotype, a huge variability in the swimming behavior has been observed, and zebrafish were divided into two distinct phenotypes: severe (at least two swim circles) and mild (other trajectories). The subdivision of both phenotypes is represented in Table S2 and Figure S2C–F (N = 3; n = 50–88/genotype; one-way analysis of variance [ANOVA] with Bonferroni post hoc test). (F) Distance swam by embryos at 48 hpf following a rescue with the hKv2.1-WT DNA construct and following a TEER test. Results show a significant reduction of the distance traveled by kcnb1 knockout models due to the expression of the hKv2.1-WT DNA (N = 3; n = 10–37/condition; unpaired t-test). (G) Representation of the average distance traveled by larvae at different days of development (from 3 to 6 days post-fertilization [dpf]) following a 10-min light–dark protocol, each period repeated 3 times. At 3 and 4 dpf, kcnb1+/+ and kcnb1 knockout zebrafish (kcnb1+/− and kcnb1−/−) presented low locomotor activity that was significantly increased from 5 to 6 dpf. A significant gap was observed starting from 5 dpf with locomotor hyperactivity for the kcnb1−/− condition as compared to kcnb1+/+ and kcnb1+/− zebrafish, reflecting the result obtained in Figure 3I. Colored statistical markers represent the comparison of locomotor activity of zebrafish with the same genotype, using the reference value at 3 dpf. Black statistical markers indicate comparisons between the three genotypes at specific time points (N = 3; n = 35/genotype; one-way ANOVA with Bonferroni post hoc test). (H) Schematic representation of individual trajectory of three zebrafish larvae per genotype obtained with ViewPoint software (Zebrabox). Between 3 and 6 dpf, a protocol was applied to larvae with three repetitions of 10 min in the light followed by 10 min in the dark (green lines: slow movements, <8 mm/s; red lines: fast movements, >8 mm/s). (I) Average distance swam by zebrafish at 6 dpf during the whole light–dark protocol described previously. Locomotor hyperactivity was observed in kcnb1−/− larvae in the light and continued to be significantly increased during the dark phase as compared to kcnb1+/+ and kcnb1+/− zebrafish (N = 3; n = 35/genotype; one-way ANOVA with Bonferroni post hoc test). (J) Quantification of the distance swam during the 5 s following each audio stimuli applied (450 Hz, 80 dB, 1 s) to larvae at 6 dpf. Both knockout conditions (kcnb1+/− and kcnb1−/−) present a significant decrease of the locomotor activity in response to audio stimuli as compared to the kcnb1+/+ condition (N = 3; n = 48–64/genotype; one-way ANOVA with Bonferroni post hoc test). *p < .05, **p < .01, ***p < .001, ****p < .0001. ns, non-significant. |
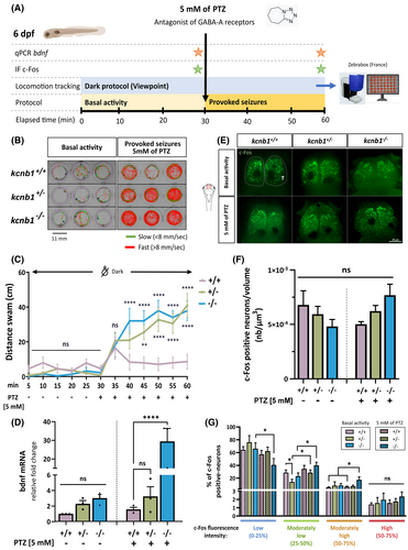
kcnb1 knockout zebrafish exhibit increased locomotor sensitivity to pentylenetetrazol (PTZ) associated with an increased expression of epileptogenesis-related genes. (A) Schematic representation of the protocol followed to identify the impact of the proconvulsant PTZ on locomotion, and bdnf and c-Fos expression. To test the seizure susceptibility in the kcnb1 knockout model, we recorded the baseline locomotor activity of 6 days post-fertilization (dpf) larvae for 30 min, followed by a 30-min exposure to 5 mmol·L−1 PTZ (Zebrabox, ViewPoint Life Sciences). We quantified the expression of two epileptogenesis-related genes at the end of each basal and provoked-seizure periods: bdnf (brain-derived neurotrophic factor) by quantitative polymerase chain reaction (qPCR) and c-Fos by immunohistochemistry (IF). GABA, γ-aminobutyric acid. (B) Schematic representation of individual trajectory of three zebrafish larvae per genotype obtained with ViewPoint software (Zebrabox). Fast swimming circles were observed for both mutant larvae conditions (kcnb1+/− and kcnb1−/−) after 30 min of 5mmol·L−1 PTZ treatment. Green lines: slow movements (<8 mm/s); red lines: fast movements (>8 mm/s). (C) Global locomotor activity of 6-dpf zebrafish in the dark was recorded by applying a protocol of 30 min of basal activity followed by 30 min of chemically induced seizures using PTZ treatment at 5 mmol·L−1. Both kcnb1+/− and kcnb1−/− larvae showed a significant increase in distance traveled during the 30-min recording after the chemical treatment as compared to kcnb1+/+ zebrafish (N = 3; n = 27/genotype; one-way analysis of variance [ANOVA] with Bonferroni post hoc test; +/− and −/− vs. +/+ after PTZ treatment: **p < .01; ****p < .0001). (D) Reverse transcription qPCR analysis of total bdnf mRNA at 6 dpf, an epileptogenesis-related gene, before and after 5mmol·L−1 PTZ treatment (N = 3; n = 30/sample; one-way ANOVA with Bonferroni post hoc test; ****p < .0001). Data are normalized to ef1α mRNA expression, and kcnb1+/+ nontreated larvae are considered as the reference value (relative fold change = 1). The kcnb1−/− condition presents a tendency toward an increased bdnf transcript expression during the basal locomotor activity, which is confirmed by a significantly increased expression after chemically induced-seizures as compared to kcnb1+/+ and kcnb1+/−. (E) Whole-mount images of 6-dpf zebrafish immunostained with anti-c-Fos, an immediate–early neuronal and epileptogenesis-related gene, obtained 30 min after basal activity and 5mmol·L−1 PTZ treatment periods. The telencephalon (T) was the major region activated after the chemical treatment for each genotype (n = 8–11/condition, dorsal view, three-dimensional reconstruction, scale bar = 50 μm, magnification = 20×). (F) Quantification of the number of c-Fos-positive neurons (nb) normalized to the volume (μm3) of the telencephalon of 6-dpf larvae during their basal or chemically treated periods using IMARIS v10.1.0 software (Oxford Instruments; see Figure S3A). The results did not show any difference in the number of activated neurons in both knockout conditions (kcnb1+/− and kcnb1−/−) as compared to the kcnb1+/+ condition in pre- and post-PTZ treatment periods (n = 8–11/condition; Mann–Whitney test). (G) Distribution (as a percentage) of c-Fos-positive neurons according to the fluorescence intensity value of c-Fos in the telencephalon of zebrafish at 6 dpf, reflecting the level of neural activation that was divided into four equal shares (from 0% to 100%): low (0%–25%), moderately low (25%–50%), moderately high (50%–75%), and high (75%–100%) neural activation. The three nontreated conditions presented a similar distribution, with a majority of low neuronal activation of c-Fos positive neurons. However, the chemically treated kcnb1−/− zebrafish presented higher global activation, with a significant shift to moderately low and moderately high neuronal activation (see Figure S3B). n = 8–11/condition; Mann–Whitney test; *p < .05. ns, non-significant. |
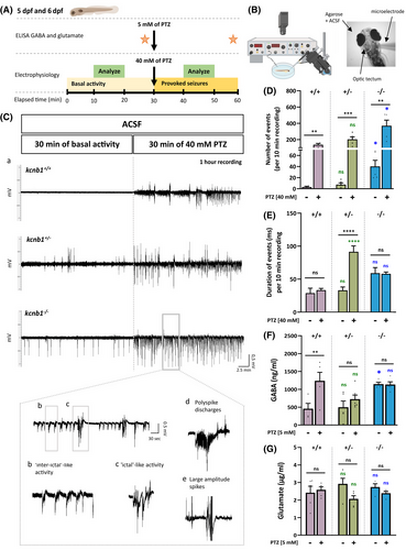
kcnb1−/− larvae show spontaneous and provoked epileptiform-like electrographic activity associated with a dysregulation of γ-aminobutyric acid (GABA). (A, B) Schematic representation of the protocol applied for electroencephalographic recordings and neurotransmitter quantification of 5 and 6 days post-fertilization (dpf) zebrafish. Neuronal activity in the optic tectum of zebrafish was recorded by applying a protocol of 30 min of basal activity followed by 30 min of 40mmol·L−1 pentylenetetrazol (PTZ) treatment. A 10-min segment in the middle of each period (basal activity and provoked seizures) was used to analyze the total number of negative spikes and duration of events for each genotype. Enzyme-linked immunosorbent assay (ELISA) was performed to quantify GABA and glutamate following a 30-min pre- and post-PTZ treatment at 5 mmol·L−1. (C; a) Representative traces of electroencephalographic recordings in the optic tectum of kcnb1+/+ and kcnb1 knockout (kcnb1+/− and kcnb1−/−) larvae showing spontaneous and provoked epileptiform-like electrographic activity in the kcnb1−/− model characterized by (b) interictal-like activity, (c) ictal-like activity, (d) polyspike discharges, and (e) large-amplitude spikes. (D, E) Quantification of electrophysiological recordings by analyzing (D) the total number of negative spikes and (E) the duration of events, over 10 min as described in panel A. kcnb1−/− larvae showed significantly increased spontaneous and provoked neuronal activity, reflected by a significant elevation of the number of spikes, although the duration of events was similar to the kcnb1+/+ condition in pre- and post-PTZ treatment. kcnb1+/− larvae presented a profile similar to the kcnb1+/+ condition in terms of number of spikes but showed a significant increase of event duration (see Table S3; n = 3–5/genotype; unpaired t-test). (F, G) Quantification of (F) GABA and (G) glutamate by ELISAs in the head of 6-dpf larvae following the 30-min pre- and post-5mmol·L−1 PTZ treatment. kcnb1−/− zebrafish present significantly increased GABA levels observed in both baseline and post-PTZ conditions conversely to kcnb1+/− larvae and compared to the kcnb1+/+ condition. We observed a lack of significant changes in glutamate levels in both kcnb1 knockout models (kcnb1+/− and kcnb1−/−) in pre- and post-PTZ conditions (N = 3–5; n = 50/sample; unpaired t-test). For panels D–G, colored statistic indications correspond to mutant conditions compared to the kcnb1+/+ condition in pre- or post-PTZ treatment. *p < .05, **p < .01, ***p < .001, ****p < .0001. ACSF, artificial cerebrospinal fluid; ns, non-significant. PHENOTYPE:
|