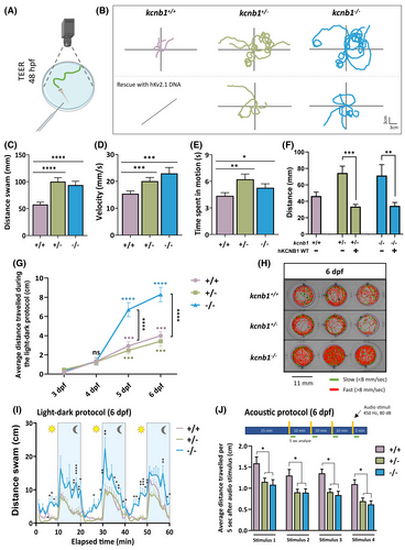
Loss of kcnb1 leads to an altered behavioral phenotype, and light- and sound-induced locomotor impairments. (A) Schematic representation of the touch-evoked escape response (TEER) test. The tail of a 48 hours post-fertilization (hpf) embryo is mechanically stimulated, and the swimming trajectory of zebrafish is recorded. (B) Top part: Representative traces of individual swimming episodes at 48 hpf showing the typical tortuous trajectory of kcnb1 knockout models (kcnb1+/− and kcnb1−/−) as compared to the straight-line trajectory of kcnb1+/+ zebrafish (5 trajectories/genotype). Bottom part: One-cell stage eggs from kcnb1+/− and kcnb1−/− zebrafish were microinjected with the hKv2.1 wild-type (WT) plasmid, and the trajectory of embryos was analyzed at 48 hpf using the TEER test. The expression of the hKv2.1-WT construct allowed the rescue of the locomotor phenotype of kcnb1 knockout models by reproducing a more linear trajectory similar to WT embryos. (C–E) The quantification of the swimming trajectory tortuosity shows a significant increase of different parameters studied in both kcnb1 knockout conditions as compared to kcnb1+/+ embryos, including an increase in (C) the distance swam, (D) the velocity, and (E) the time spent in motion. Furthermore, within the same genotype, a huge variability in the swimming behavior has been observed, and zebrafish were divided into two distinct phenotypes: severe (at least two swim circles) and mild (other trajectories). The subdivision of both phenotypes is represented in Table S2 and Figure S2C–F (N = 3; n = 50–88/genotype; one-way analysis of variance [ANOVA] with Bonferroni post hoc test). (F) Distance swam by embryos at 48 hpf following a rescue with the hKv2.1-WT DNA construct and following a TEER test. Results show a significant reduction of the distance traveled by kcnb1 knockout models due to the expression of the hKv2.1-WT DNA (N = 3; n = 10–37/condition; unpaired t-test). (G) Representation of the average distance traveled by larvae at different days of development (from 3 to 6 days post-fertilization [dpf]) following a 10-min light–dark protocol, each period repeated 3 times. At 3 and 4 dpf, kcnb1+/+ and kcnb1 knockout zebrafish (kcnb1+/− and kcnb1−/−) presented low locomotor activity that was significantly increased from 5 to 6 dpf. A significant gap was observed starting from 5 dpf with locomotor hyperactivity for the kcnb1−/− condition as compared to kcnb1+/+ and kcnb1+/− zebrafish, reflecting the result obtained in Figure 3I. Colored statistical markers represent the comparison of locomotor activity of zebrafish with the same genotype, using the reference value at 3 dpf. Black statistical markers indicate comparisons between the three genotypes at specific time points (N = 3; n = 35/genotype; one-way ANOVA with Bonferroni post hoc test). (H) Schematic representation of individual trajectory of three zebrafish larvae per genotype obtained with ViewPoint software (Zebrabox). Between 3 and 6 dpf, a protocol was applied to larvae with three repetitions of 10 min in the light followed by 10 min in the dark (green lines: slow movements, <8 mm/s; red lines: fast movements, >8 mm/s). (I) Average distance swam by zebrafish at 6 dpf during the whole light–dark protocol described previously. Locomotor hyperactivity was observed in kcnb1−/− larvae in the light and continued to be significantly increased during the dark phase as compared to kcnb1+/+ and kcnb1+/− zebrafish (N = 3; n = 35/genotype; one-way ANOVA with Bonferroni post hoc test). (J) Quantification of the distance swam during the 5 s following each audio stimuli applied (450 Hz, 80 dB, 1 s) to larvae at 6 dpf. Both knockout conditions (kcnb1+/− and kcnb1−/−) present a significant decrease of the locomotor activity in response to audio stimuli as compared to the kcnb1+/+ condition (N = 3; n = 48–64/genotype; one-way ANOVA with Bonferroni post hoc test). *p < .05, **p < .01, ***p < .001, ****p < .0001. ns, non-significant.
|
